Computational Simulation Of Four Non-Covalent KRAS G12D Inhibitors Suggests Verastem's VS-7375 May Achieve The Deepest Signaling Suppression
Computational simulation of KRAS G12D conformational cycling across VS-7375, BBO-11818, HRS-4642, and INCB161734 under within-cycle and multi-day dosing suggests VS-7375 may reach 90% suppression at the lowest free drug concentration.
Disclosure: The author holds beneficial long positions in Revolution Medicines, Inc. (NASDAQ: RVMD), Verastem Oncology, Inc. (NASDAQ: VSTM) and BridgeBio Oncology Therapeutics (NASDAQ: BBOT). The author holds no position in GenFleet Therapeutics (Shanghai) Inc. (HKEX: 2595), Incyte Corporation (NASDAQ: INCY) or Jiangsu Hengrui Pharmaceuticals. This article is for informational and educational purposes only and is not financial advice. The computational kinetic simulation presented here is a speculative modeling exercise built on published biochemical parameters where available and on estimates where not, and cannot predict the behavior of any of these compounds in patients. Although the author is a physician, this content represents a personal analytical perspective and does not constitute medical advice. The author receives no compensation for this article and has no business relationship with any of the companies referenced. This article has not been independently peer-reviewed. See the full "Legal Information and Disclosures" section below.
In 2026, an estimated 67,530 Americans will be diagnosed with pancreatic cancer, with five-year survival stalled at roughly 13%. Pancreatic ductal adenocarcinoma (PDAC) accounts for the overwhelming majority of these cases and is defined by oncogenic KRAS mutations, present in over 90% of tumors. Nearly all these mutations occur at codon 12, where glycine is replaced by another amino acid. The dominant variant in PDAC is G12D (aspartate) at approximately 40%, followed by G12V (valine) and G12R (arginine).
For more than three decades after KRAS was identified as an oncogenic driver, it was considered undruggable. The breakthrough came in 2013, when Kevan Shokat's group identified a cryptic pocket beneath the switch-II region of KRAS G12C that opens when the protein is GDP-bound. That pocket accepted a covalent warhead anchored to the mutant cysteine, a design principle that led to sotorasib and adagrasib, approved for KRAS G12C-mutant NSCLC. But G12C accounts for fewer than 2% of PDAC cases.
Revolution Medicines pursued a different approach with its RAS(ON) multi-selective inhibitor class, which targets GTP-bound mutant RAS across multiple variants, including G12D. On April 13, 2026, Revolution Medicines reported topline results from its Phase 3 RASolute 302 trial of the lead oral compound daraxonrasib in previously treated metastatic PDAC (NCT06625320). Median overall survival in the intent-to-treat population was 13.2 months versus 6.7 months for chemotherapy, with a hazard ratio of 0.40 and p < 0.0001, corresponding to a 60% reduction in the risk of death. I discussed these results in my previous article.
If daraxonrasib now has Phase 3 evidence of efficacy, why pursue mutant-selective inhibitors in parallel? Daraxonrasib inhibits wild-type RAS alongside the mutant, and wild-type RAS drives keratinocyte and mucosal proliferation downstream of EGFR, producing on-target toxicities including rash, stomatitis, diarrhea, and paronychia, with rash the most frequent at 91% across doses of 160 to 300 mg (Garrido-Laguna et al., 2025). Because this toxicity may limit dosing before mutant suppression is complete, a mutant-selective compound with a small wild-type footprint would be expected to have a wider therapeutic window and to pair more readily with partner drugs. Combinability matters because most KRAS-driven cancers relapse through adaptive MAPK feedback reactivation. BBO-11818 combines with cetuximab in a KRAS G12D CDX model, VS-7375 shows synergy with a PRMT5 inhibitor and with avutometinib, and Revolution Medicines is developing its own G12D-selective program. Wild-type RAS inhibition may also carry a therapeutic benefit, however, a biological tradeoff examined below.
Revolution Medicines' lead G12D-selective program is zoldonrasib. Like daraxonrasib, zoldonrasib is a tri-complex inhibitor that uses cyclophilin A as a chaperone, but it is covalent and G12D-selective. After binding cyclophilin A in the cytoplasm, the binary complex docks into the switch-II pocket of GTP-bound KRAS G12D, positioning an aziridine warhead next to the mutant aspartate so that a covalent bond forms with D12. The drug-KRAS-CypA complex then stays bound until the protein is degraded. Clinically, zoldonrasib produced a 61% objective response rate in 18 NSCLC patients at 1200 mg once daily (AACR 2025), and on January 8, 2026 the FDA granted it Breakthrough Therapy Designation for previously-treated KRAS G12D-mutated NSCLC. In first-line PDAC, zoldonrasib plus FOLFIRINOX yielded a 63% partial response rate in 19 patients, supporting initiation of RASolute 305, the first Phase 3 trial for zoldonrasib.
Because zoldonrasib is covalent and a tri-complex inhibitor, its occupancy is not set by a Kd-based binding equilibrium and cannot be compared on the same footing as non-covalent binders. The rest of this article restricts the analysis to four non-covalent G12D inhibitors, whose occupancy is governed by free drug concentration and published binding kinetics. These four have the most complete publicly disclosed biochemistry. Other clinical-stage non-covalent inhibitors, such as AstraZeneca's AZD0022 and Eli Lilly's LY3962673, are excluded because their residence-time and human pharmacokinetic data are not yet publicly disclosed. AZD0022's Phase 1 ALAFOSS-01 trial (NCT06599502) was terminated on March 5, 2026, which strengthens the exclusion.
Published clinical response rates for non-covalent KRAS G12D inhibitors currently sit in a similar range, so clinical data alone cannot yet identify which candidate may deliver the deepest and most durable signaling suppression. The simulation explores this question using published biochemical affinities, residence times, and pharmacokinetic parameters at plausible human free-drug exposures. The four non-covalent G12D inhibitors compared here are VS-7375, BBO-11818, HRS-4642, and INCB161734.
VS-7375 is the lead program at Verastem and its partner GenFleet. Coma et al. report a KD of 12 to 18 picomolar and a residence time of 18 to 24 hours, essentially identical for the ON and OFF states. That is low-picomolar reversible binding with day-scale residence, close to the floor of what a small molecule can achieve without a covalent bond. GenFleet reported a 41% objective response rate in 59 heavily pretreated PDAC patients at the RP2D of 600 mg QD (ESMO 2025, data cutoff September 27, 2025), along with a 68.8% ORR in 16 NSCLC patients at WCLC 2025, both from the Chinese trial NCT06500676. The US Phase 1/2a trial (NCT07020221) has reported no dose-limiting toxicities at 600 mg, with preliminary tumor reductions observed in 4 of 5 efficacy-evaluable patients as of October 2025 and a more mature interim update expected in the first half of 2026.
BBO-11818 from BridgeBio Oncology Therapeutics is a non-covalent pan-KRAS inhibitor. It is included here despite not being G12D-selective because it has the deepest published OFF-state affinity in this comparison and the most asymmetric binding profile. As Stahlhut et al. (2026) reported and in BBOT's AACR-NCI-EORTC 2025 poster, SPR measurements give a KD of 7.4 nM for the GppNHp-bound ON state and less than 0.003 nM for the GDP-bound OFF state, a ratio exceeding 2,000-fold. The OFF-state value is the assay floor rather than a point measurement, so the true KD_OFF may be tighter still. Cellular pERK EC50 tracks across the allele series: 1.5 nM for G12C, 3.1 nM for G12D, 3.5 nM for G12A, 10 nM for G12V, 12 nM for G12S, and 22 nM for G13D. G12R and Q61 variants are unlikely to be usefully inhibited at clinical free-drug exposures (pERK EC50 357 nM and 278 nM, respectively), and NRAS- and BRAF-mutant control lines are insensitive (pERK EC50 >10 µM). BBO-11818 entered Phase 1 as KONQUER-101 (NCT06917079), and initial monotherapy data in January 2026 showed a confirmed partial response with 56% tumor reduction in one PDAC patient. The asymmetric profile raises a mechanistic question: can OFF-state depth alone, without tight ON-state binding, produce deep signal suppression?
HRS-4642 from Jiangsu Hengrui is a non-covalent KRAS G12D inhibitor reported by Zhou et al. (2024) to bind both GDP- and GTP-bound KRAS G12D, with a published SPR KD of 0.083 nM. State-resolved kinetics are not separately reported in the public record, so the simulation assumes symmetric ON- and OFF-state affinity. HRS-4642 is formulated as a nanoliposome and dosed intravenously, and was presented by Hengrui at ESMO 2025 with clinical data from the Chinese Phase 1 trial (NCT05533463). The simulation treats the reported Cmax as free drug available for target binding, which likely overstates the fraction actually available because most of the circulating compound remains encapsulated in the liposomal carrier.
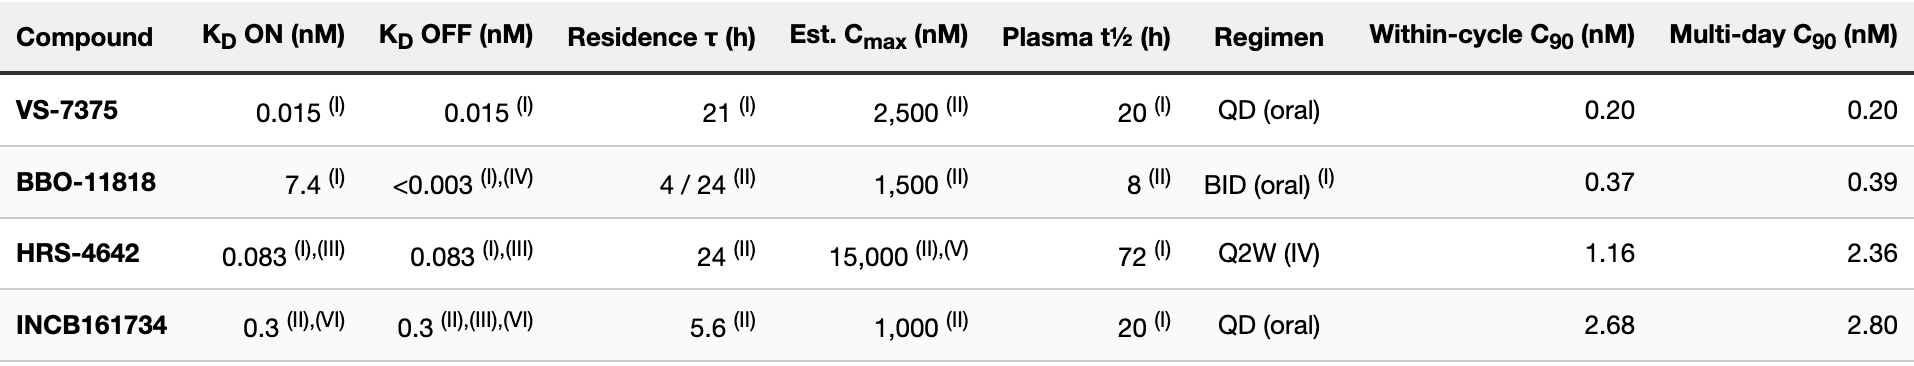
INCB161734 from Incyte is a non-covalent dual ON/OFF KRAS G12D binder. Incyte has disclosed only that the binding affinity is in the picomolar range, without quoting a specific KD. In March 2026, four EU member states placed the Phase 1 trial on partial clinical hold following a treatment-related pneumonitis death, a development that may affect program timelines but does not alter the underlying biochemistry used in this simulation. The simulation uses a KD of 0.3 nM for both ON and OFF states, the most conservative single-number interpretation of an unquantified picomolar claim. If the true KD is lower, INCB161734's modeled C90 moves with it. Simulation parameters for all four compounds are collected in Table 1.
The simulation tracks a fixed pool of KRAS G12D cycling between ON and OFF states at published rates, with each drug binding according to its own kinetics. Three parameter choices warrant explanation.
The intrinsic GTP hydrolysis rate is set to 0.012 per minute (2.0 × 10⁻⁴ s⁻¹), matching the value of ~1.9 × 10⁻⁴ s⁻¹ measured for G12D by Hunter et al. (2015). This places G12D in the high-intrinsic-GTPase tier of KRAS mutants alongside WT, G12C, and G13D, though roughly two- to three-fold slower than wild-type itself. The basal ON fraction is 0.88, reflecting GAP insensitivity, and the nucleotide exchange rate is chosen to match this steady state given the turnover rate below.
KRAS protein half-life is set to 24 hours. This reflects wild-type cycloheximide chase data, adjusted by the observation that G12D escapes LZTR1-CUL3 ubiquitination (Damianou et al., 2024, extending Bigenzahn et al., 2018), which makes it at least as long-lived as wild-type. Protein turnover is modeled as first-order degradation of all four states at rate ln(2)/24 hr, balanced by synthesis of new OFF-free (GDP-bound) protein. This ensures that OFF-bound complexes do not saturate at unity but are continuously eroded by proteolysis.
Drug-bound KRAS is assumed not to undergo SOS-mediated nucleotide reloading. This is directly supported for BBO-11818, which Stahlhut et al. showed inhibits SOS-mediated exchange on KRAS G12D with IC₅₀ ≈ 0.5 nM. For the other three compounds, the assumption rests on the shared structural basis of the switch-II/Helix-3 pocket class. Hydrolysis on drug-bound KRAS proceeds at 30% of the intrinsic rate, a defensible midpoint in the absence of compound-specific measurements.
The system has four states: ON free, ON bound, OFF free, and OFF bound. Mass conservation is verified analytically and numerically to machine precision (deviation below 10⁻¹³), and a stochastic Gillespie simulation agrees with the deterministic ODE solution to within 0.5 percentage points on suppression. Figure 1 shows the steady-state distribution of KRAS G12D across the four states against free drug concentration, plotted on a log scale from 0.1 pM to 10 μM, with dashed vertical lines marking each compound's estimated plasma Cmax.
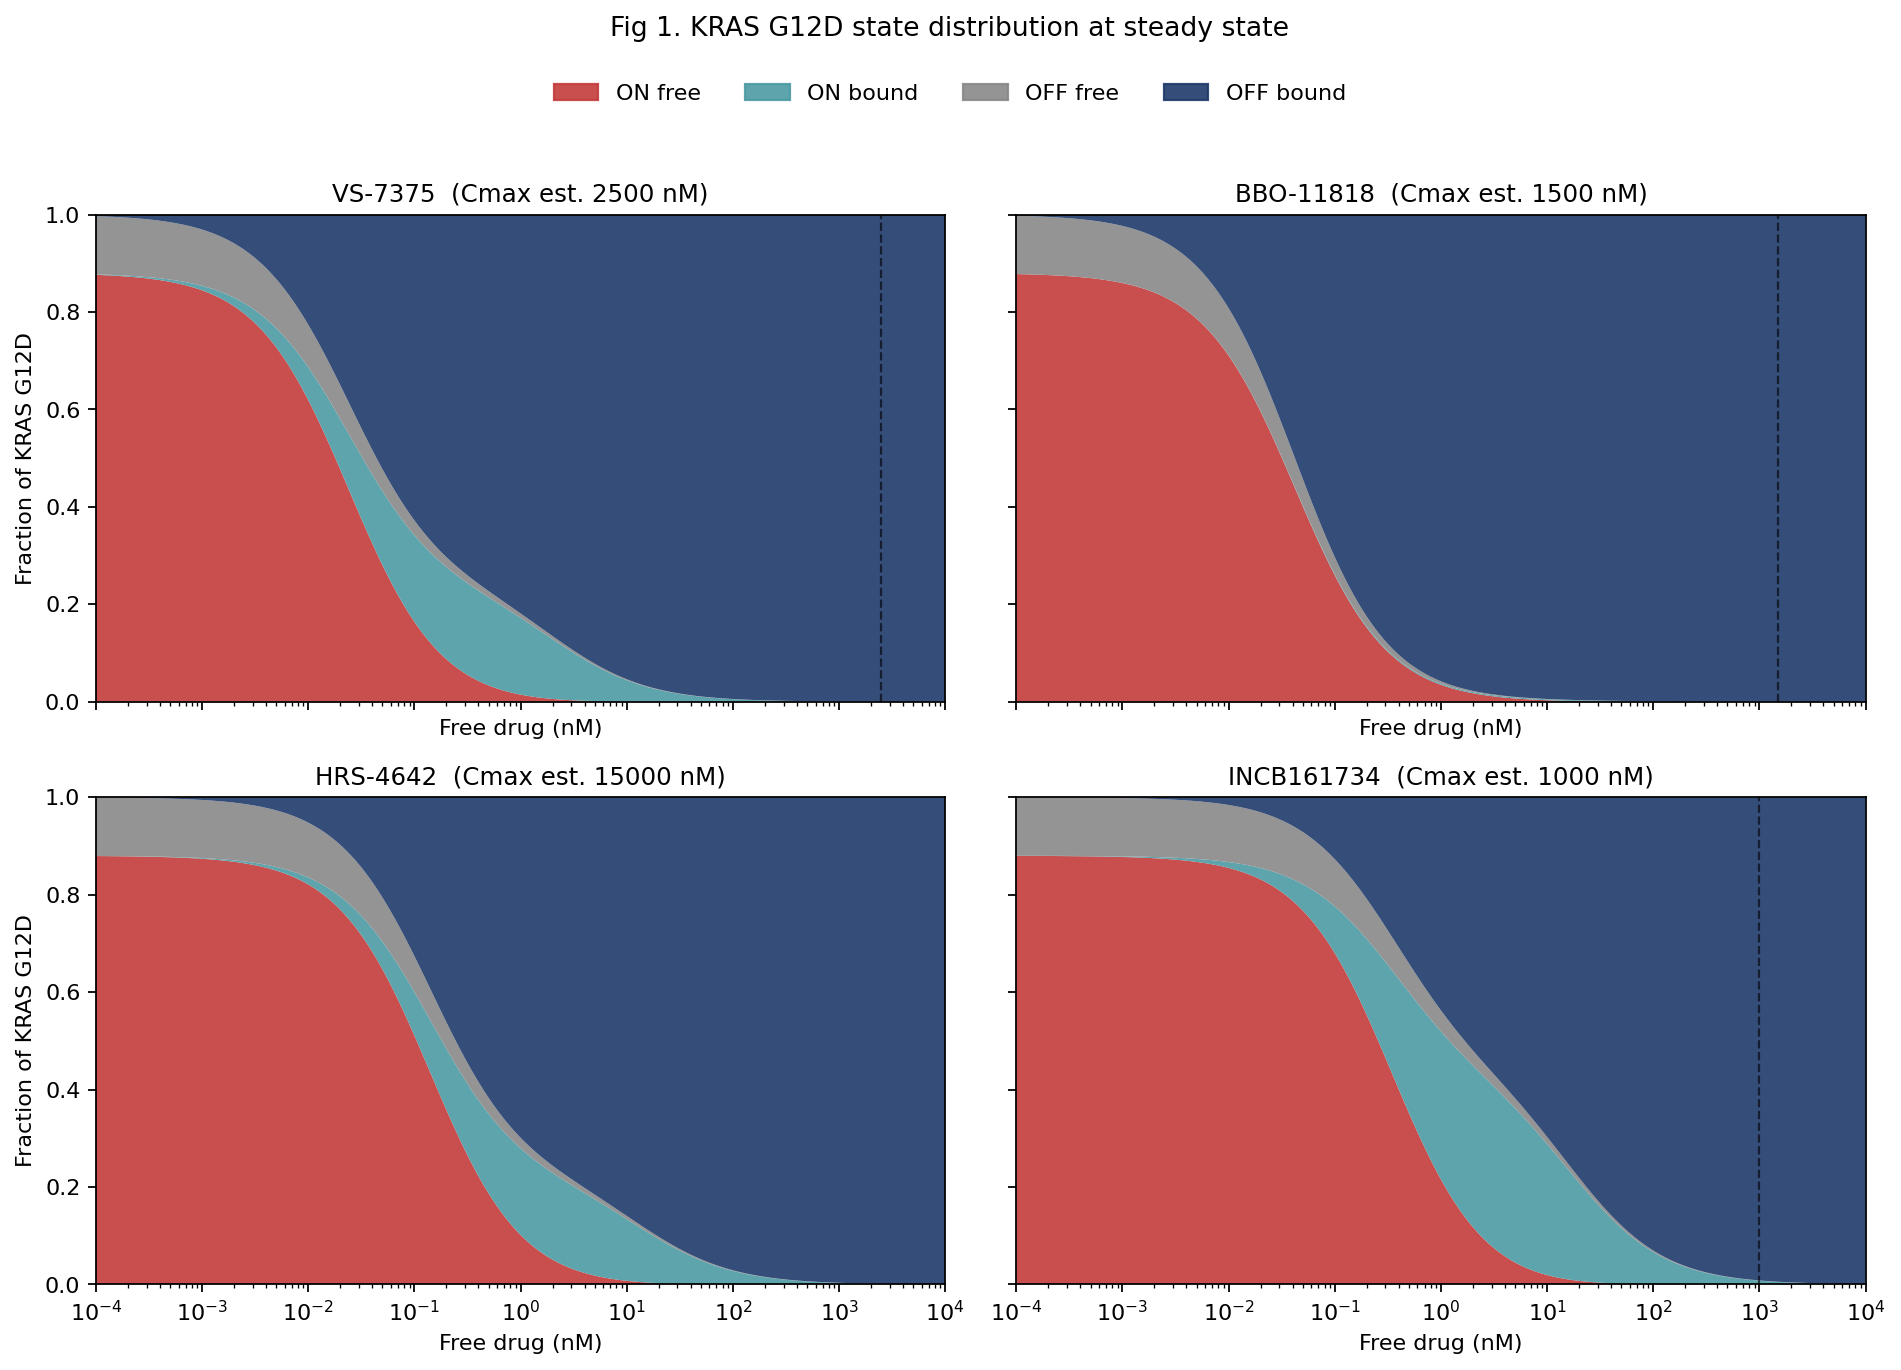
VS-7375 drives the population into the drug-bound OFF state starting in the low-picomolar range. HRS-4642 behaves similarly, with the curve shifted rightward consistent with its higher KD. INCB161734 sits further right still. BBO-11818 shows the most striking pattern: despite having by far the weakest ON-state KD at 7.4 nM, it produces near-complete OFF-bound accumulation at single-digit nanomolar concentrations. The reason is that its OFF-state pocket is so deep that any molecule reaching the OFF state is effectively trapped. The ON-bound intermediate prominent in the VS-7375 panel is almost absent here, because molecules that do bind ON migrate directly into an OFF-state pocket more than 2,000-fold tighter the moment they hydrolyze.
The quantitative metric is C90, the free-drug concentration required for 90% suppression of basal signaling at steady state. VS-7375 reaches C90 at 0.20 nM, BBO-11818 at 0.37 nM, HRS-4642 at 1.16 nM, and INCB161734 at 2.68 nM. BBO-11818's result is notable: despite an ON-state KD roughly 500-fold weaker than VS-7375's, its C90 is less than twofold higher, because the more than 2,000-fold ON-to-OFF affinity ratio pulls the population into the drug-bound OFF sink. What matters for signal suppression is neither the ON-state KD nor the OFF-state KD alone, but the combination of the two, weighted by cycle kinetics and protein turnover.
A few load-bearing assumptions deserve to be stated up front. The most consequential is the reading of VS-7375 as a symmetric picomolar binder in both nucleotide states, drawn from a single abstract line reporting "12 to 18 pM in both states" without state-resolved SPR traces in the public record. If VS-7375 is in fact asymmetric with a nanomolar ON-state KD rather than picomolar, VS-7375's within-cycle C90 rises to roughly 1.5 nM at an ON-state KD of 1 nM (with OFF held at 15 pM), and to roughly 1.8 nM at 10 nM. The second is the drug-bound exchange ratchet (f_exchange,bound = 0), which shifts BBO-11818's C90 by more than 100-fold if relaxed to 0.3, while leaving the symmetric binders nearly unchanged. This assumption has compound-specific empirical support for BBO-11818 from Stahlhut et al., but is a structural extrapolation for the other three.
By contrast, the results appear robust to f_hyd between 0.1 and 0.5 (<10% C90 shift), to f_ON between 0.80 and 0.92, to K_HYD within the published G12D range, and to BBO-11818's KD_ON from 1 nM to the limit where BBO-11818 has no ON-state binding, since the OFF branch dominates. At f_ON values as low as 0.70, BBO-11818's C90 drops below VS-7375's. This likely sits outside the range plausible for G12D-driven tumors, though direct measurements of basal ON fraction in PDAC in situ are not available to confirm this with certainty.
Figure 2 shows Gillespie stochastic simulations at a common free drug concentration of 1 nM, tracking five individual KRAS G12D molecules per panel over a six-hour window. Holding concentration constant across compounds isolates mechanism from exposure.
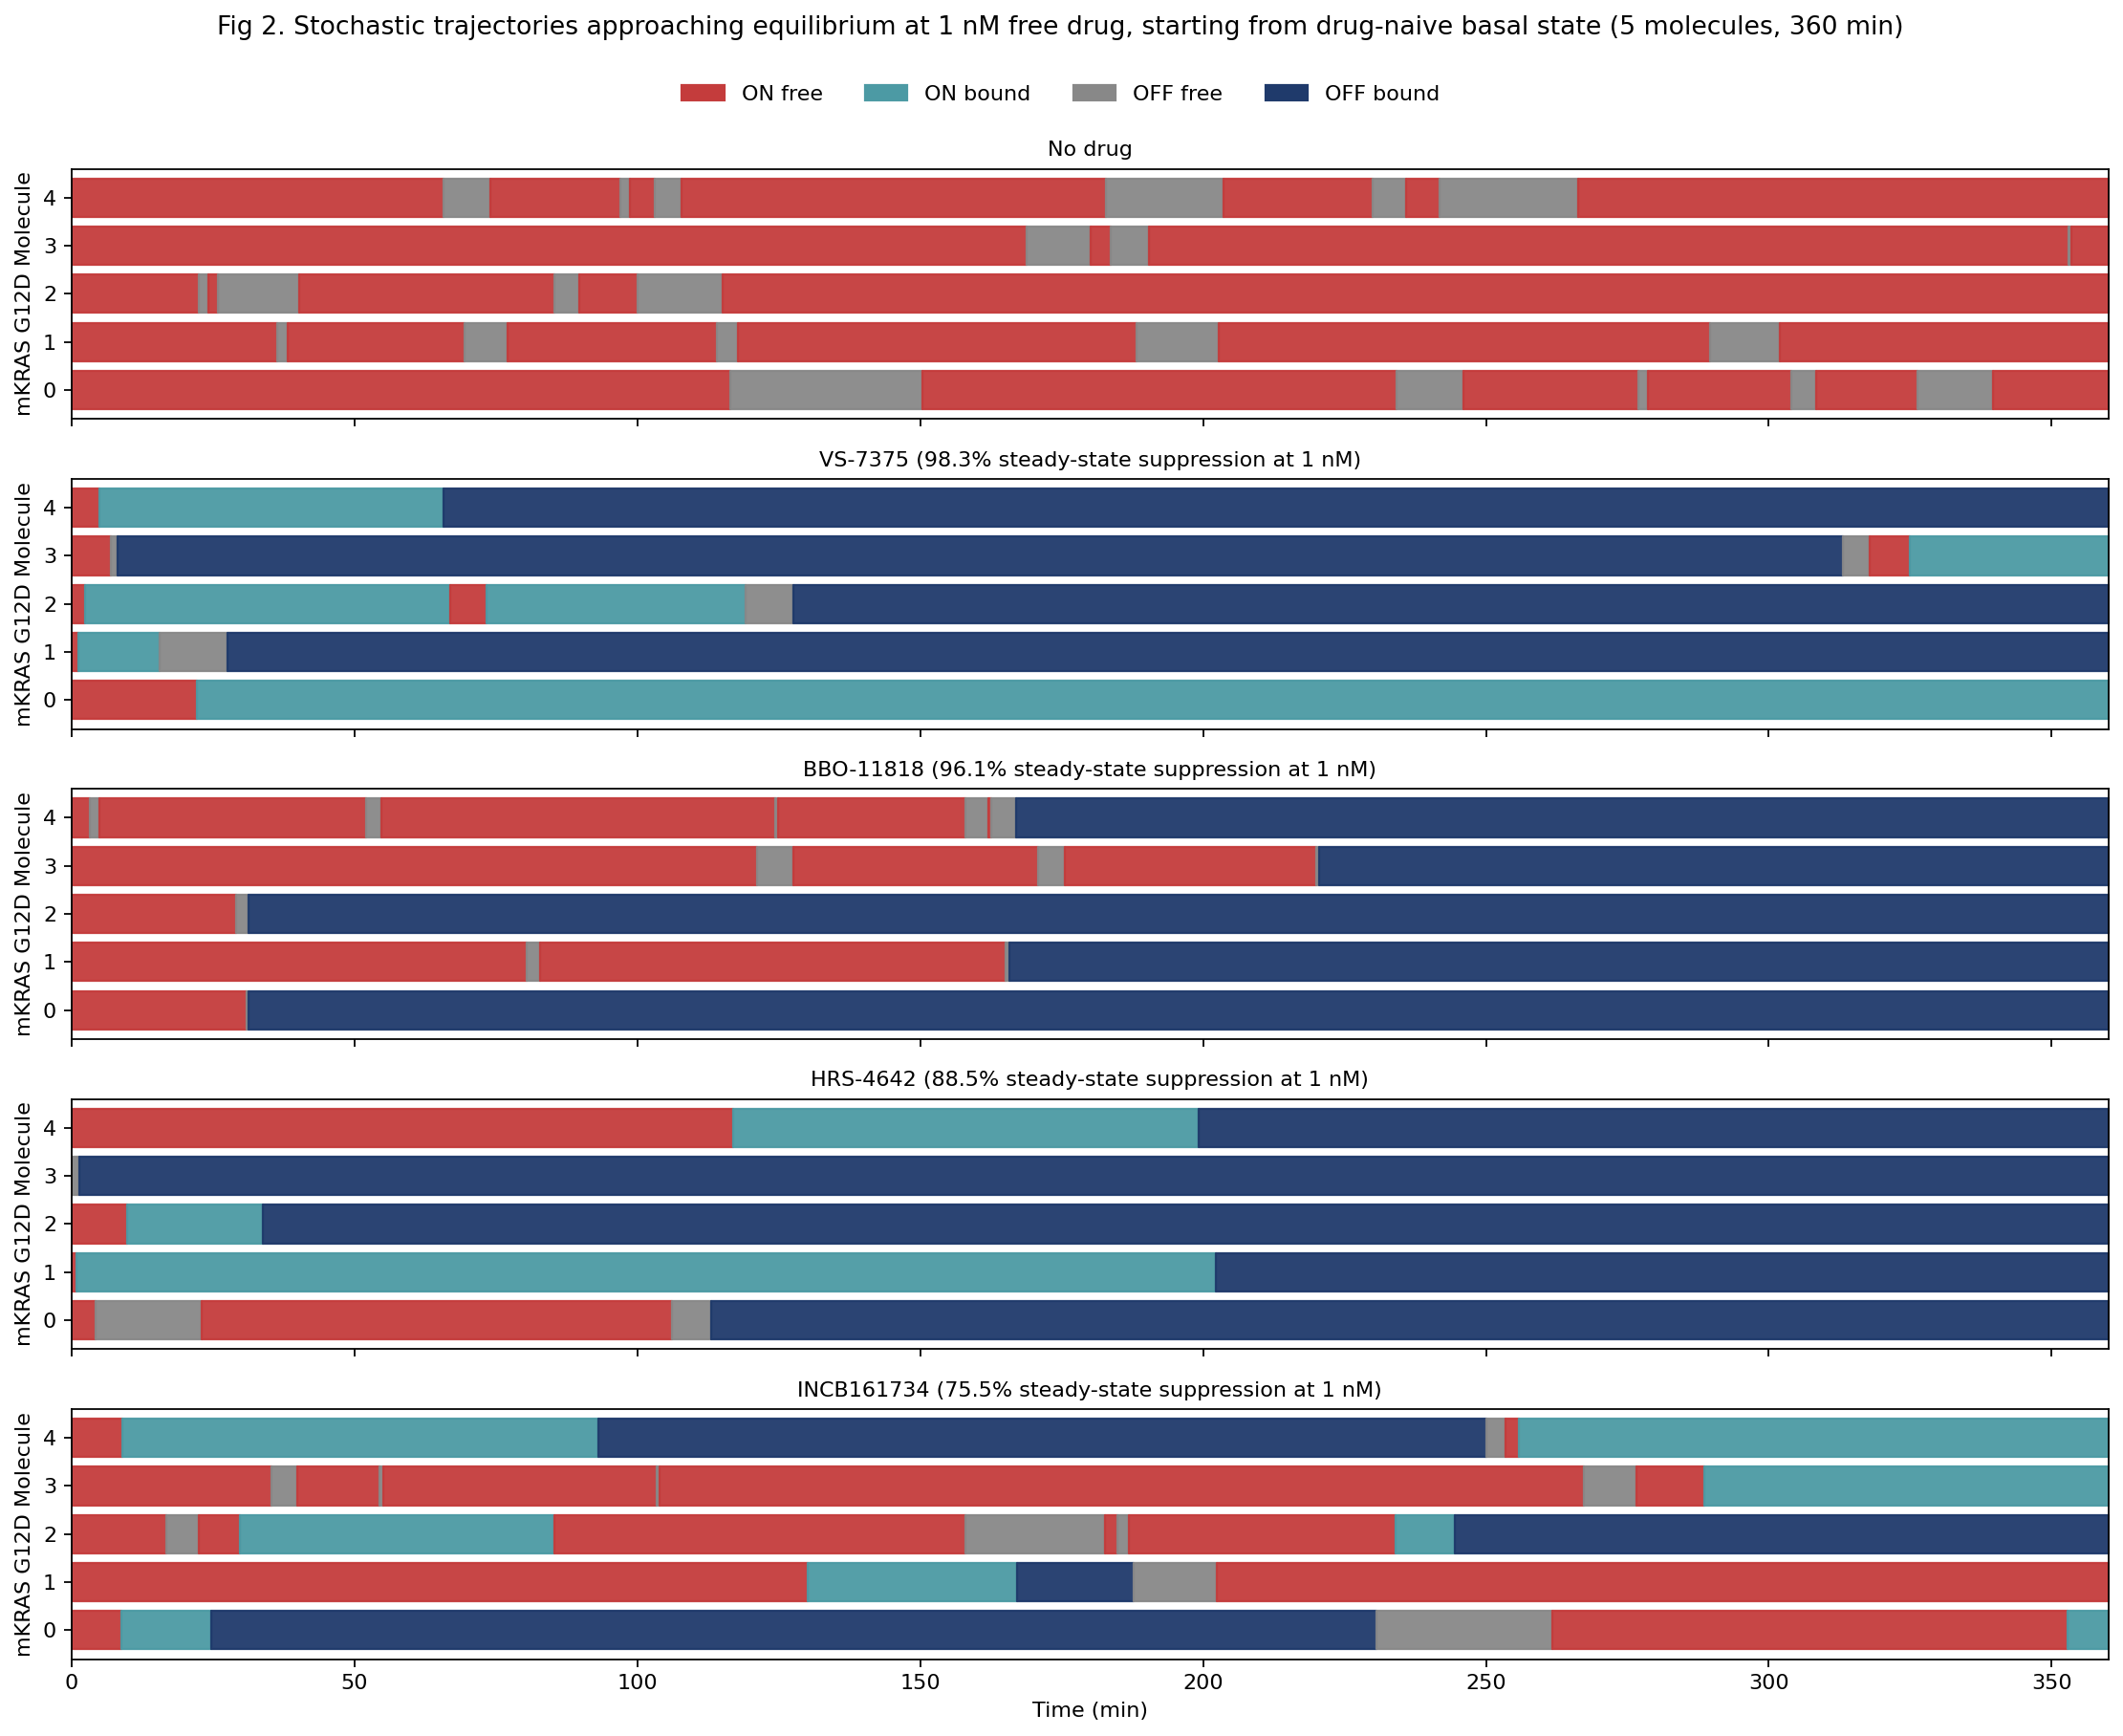
VS-7375 shows almost no red across the window: most molecules transit briefly through ON-bound before settling into OFF-bound, with occasional long ON-bound plateaus reflecting the 18-24 hour residence time, giving 98.3% suppression. BBO-11818 shows scattered red episodes across the first few hours before the OFF trap consumes most of the population, giving 96.1%. HRS-4642 shows more time in red and teal, with molecules reaching the OFF trap over timescales ranging from minutes to several hours, giving 88.5%. INCB161734 shows substantially more red across the window with repeated re-entry into signaling, giving 75.5%.
Figure 3a renders the same information as standard concentration-response curves. Figure 3b translates C90 into what it requires of tumor penetration, expressed as a percentage of estimated plasma free drug that must reach the tumor free compartment.
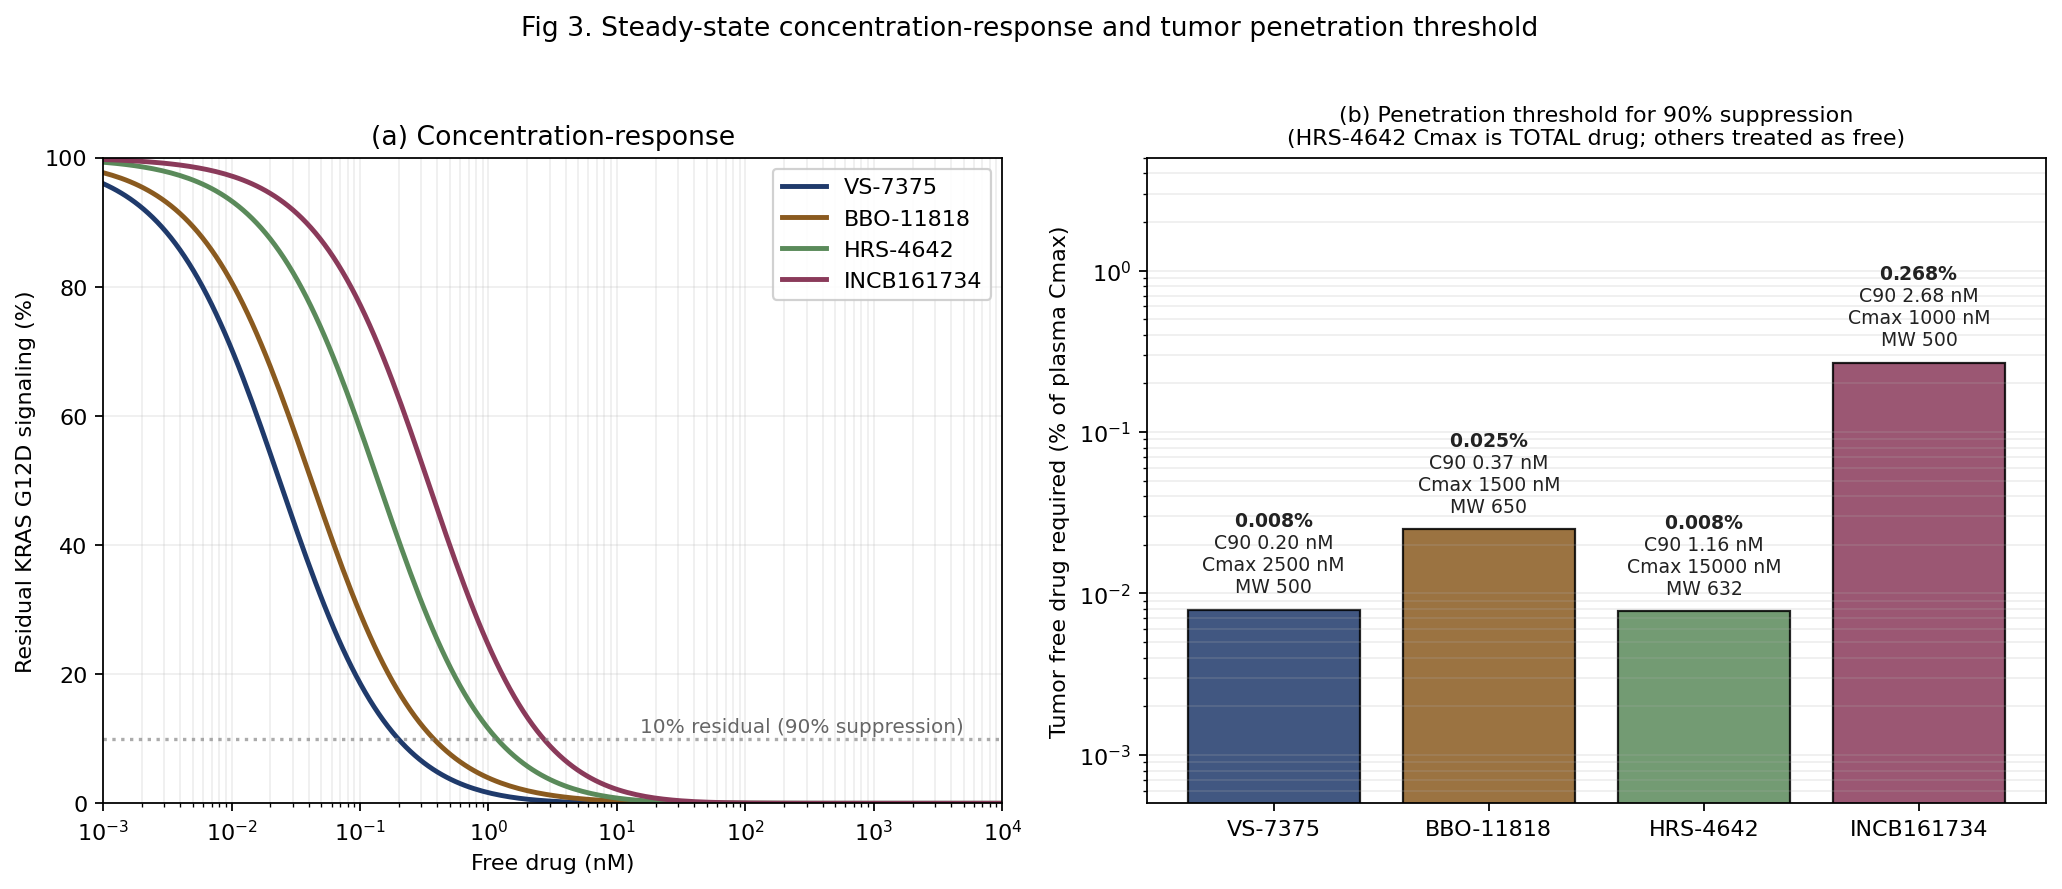
VS-7375 and HRS-4642 both require only about 0.008% of plasma free drug to reach the tumor for 90% suppression. BBO-11818 requires about 0.025%. INCB161734 sits more than an order of magnitude above the lowest pair at 0.27%, driven by a lower Cmax combined with a higher C90. The HRS-4642 number is doubly optimistic: its Cmax is a murine cross-species proxy (Zhou et al., 2024), and it reflects total drug including the majority encapsulated in the liposomal carrier, so the true free-drug penetration threshold in humans is higher than 0.008%. All four numbers rest on the convention, disclosed above, that estimated Cmax values are treated as free drug; published plasma protein binding is not available for any of the four compounds. These numbers are also indifferent to the pancreatic microenvironment, where dense stroma, elevated interstitial pressure, and irregular vasculature can materially reduce free drug availability. Interpretation should be directional, not absolute.
Within-cycle C90 at constant free drug is not the whole picture. Real patients experience pulsatile PK, and a compound's practical performance depends on how well it holds target engagement through dosing troughs. Figure 4 shows a 28-day simulation under each compound's actual clinical regimen and terminal half-life as specified in Table 1: oral QD for VS-7375 and INCB161734, oral BID for BBO-11818, and IV Q2W for HRS-4642. The simulation uses explicit pulsatile PK with dose superposition, so residual drug from prior doses adds to each new dose rather than each interval being treated in isolation. Doses are scaled so the steady-state peak reaches 0.2% of estimated Cmax, a sub-saturating target chosen so that differences between compounds are visible rather than compressed at the ceiling.
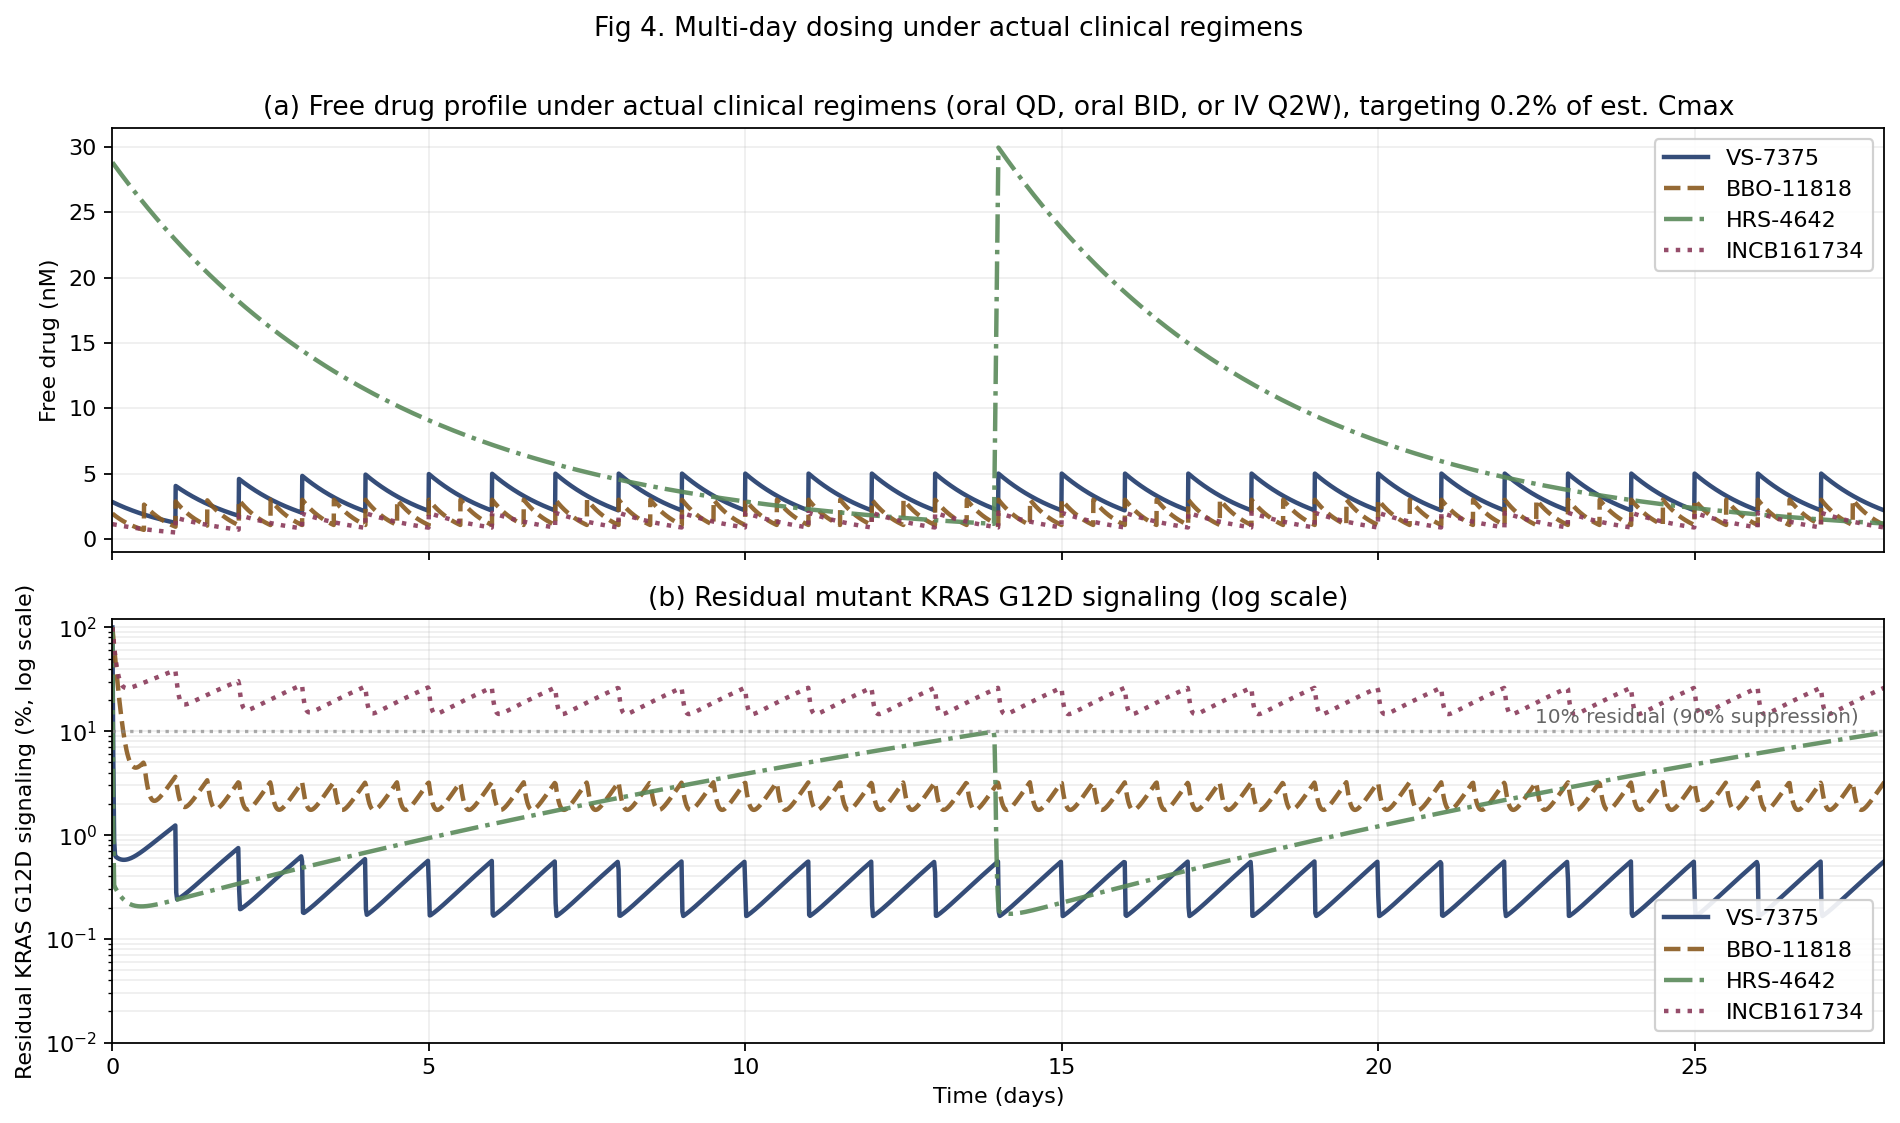
At 0.2% of estimated Cmax, VS-7375 pushes residual signaling to near zero within the first day and holds it there for the full 28 days. BBO-11818 approaches near-complete suppression with small twice-daily oscillations around 2-3% residual, as each trough allows brief re-equilibration. HRS-4642 reaches deep suppression at the Q2W peak, but residual signaling rises as the concentration decays across the 14-day cycle. INCB161734 oscillates between roughly 15% and 26% residual across the four weeks and does not reach 90% suppression at this dose. Multi-day C90 values under these regimens are 0.20 nM for VS-7375 (QD), 0.39 nM for BBO-11818 (BID), 2.36 nM for HRS-4642 (Q2W IV), and 2.80 nM for INCB161734 (QD). HRS-4642's Q2W interval roughly doubles its C90 relative to the within-cycle figure because the long dosing interval creates deep troughs. This is the clinical cost of IV Q2W dosing, and the trough effect narrows the gap with INCB161734 from 2.3-fold at constant drug to 1.2-fold under actual PK.
At the AACR Special Conference on RAS Oncogenesis and Therapeutics in March 2026, Coma et al. reported a head-to-head preclinical comparison in the KP4 KRAS G12D pancreatic CDX model. VS-7375 (50 mg/kg BID), zoldonrasib (100 mg/kg QD), and daraxonrasib (25 mg/kg QD) all produced similar initial tumor regression through day nine. By day 20, however, the two RAS(ON) inhibitors progressively lost anti-tumor activity, with tumor volumes climbing past 850 mm³ by day 30, while VS-7375 maintained sustained regression (~80 mm³ at day 30). The comparison is directional rather than definitive: it uses a single CDX model without plasma AUC matching across compounds, so efficacy differences could reflect exposure differences rather than mechanism differences. The relationship between day-30 preclinical outgrowth and clinical durability also remains to be established.
The results of the computational simulation presented here rest on published biochemistry where available and estimates where not, as detailed in Table 1. Key inputs are drawn from published SPR measurements, clinical PK disclosures, and conference abstracts. The most important estimate is the Cmax for HRS-4642, a murine cross-species proxy that reflects total drug, encapsulated plus released, rather than free drug. The results rest on two load-bearing assumptions, the symmetric-KD reading of VS-7375 and the drug-bound exchange ratchet (f_exchange,bound = 0) applied uniformly across compounds, together with a KRAS G12D protein half-life estimate of 24 hours. They should be read as conditional on these parameters; independent state-resolved KD measurements, published free-drug Cmax values, or exposure-matched in vivo data could change them.
Beyond parameter uncertainty, the simulation has a biological limitation that matters for interpretation. The competitive case for a G12D-selective inhibitor rests partly on sparing wild-type RAS in non-tumor tissues, which yields a wider therapeutic window than daraxonrasib's pan-RAS mechanism. The same selectivity may also constrain efficacy. Sealover et al. reported in 2025 that wild-type RAS signaling is an essential therapeutic target in RAS-mutated cancers. In KRAS-mutant cells, wild-type HRAS and NRAS carry most of the flux through the PI3K-AKT arm of the pathway while the mutant KRAS engages the RAF-MEK-ERK arm. A mutation-specific inhibitor therefore silences MAPK but leaves PI3K driven by the remaining wild-type RAS proteins. The same study showed that combining covalent KRAS G12C inhibitors with PI3K inhibitors produces synergistic cytotoxicity in G12C-mutant cells in a manner that depends on intact wild-type RAS signaling. The implication for this simulation is that biochemical depth of suppression on the mutant ON/OFF axis, which is what the C90 scores, may not translate cleanly into clinical benefit if the PI3K arm remains open through wild-type RAS. Combination with PI3K inhibitors may therefore be a practical necessity for any G12D-selective compound to approach daraxonrasib's monotherapy effectiveness, and the historical toxicity of PI3K inhibition in combination regimens is the cost the field will have to negotiate. Daraxonrasib, by inhibiting wild-type RAS alongside the mutant, closes both arms at once and does not face this trade-off, at the cost of the wild-type toxicity that motivated G12D-selective development in the first place.
The simulation suggests a mechanistic sketch of the four non-covalent compounds. If the symmetric-KD reading holds, VS-7375 behaves as a balanced dual ON/OFF reversible binder with low-picomolar affinity and long residence, at the extreme end of the published range for this class. BBO-11818 appears to operate as an asymmetric binder that trades ON-state affinity for an extraordinary OFF trap, a tradeoff that looks close to cost-neutral on a C90 basis under the exchange-ratchet assumption, with pan-KRAS activity (strongest for G12D, G12C, and G12A; moderate for G12V, G12S, and G13D; negligible for G12R and Q61 variants) as a secondary feature. HRS-4642 looks like a conventional dual binder with published sub-nanomolar affinity. Under its Q2W clinical regimen, IV dosing and a liposomal formulation that reduces the free-drug fraction likely handicap its multi-day performance relative to oral compounds, though the degree of handicap depends on parameters not yet published. INCB161734 is described only in qualitative terms by its sponsor, and its modeled position rests on a single KD assumption that may understate true affinity.
The simulation asked which of the four non-covalent KRAS G12D inhibitors may deliver the deepest and most durable signaling suppression at plausible human free-drug exposures. If VS-7375's published picomolar affinity reflects tight binding to both the ON and OFF states of KRAS G12D, as the Coma et al. abstract suggests, then VS-7375 looks most promising on that axis, combining very tight binding to both states with a residence time on the order of a day. BBO-11818 is harder to place on the same axis. Its picomolar OFF-state affinity, measurable ON-state activity, and selectivity over NRAS and HRAS give it a pan-KRAS profile from a single molecule, which is a different kind of asset than G12D depth. State-resolved SPR kinetics for VS-7375 and human free-drug Cmax values for both compounds would tighten these projections, and either could move the picture.
Whether biochemical depth of suppression translates into clinical benefit is a separate question, depending partly on whether the PI3K arm carried by wild-type RAS becomes the rate-limiting constraint on efficacy. These are simulation outputs built on published parameters and defensible estimates, not predictions of clinical performance. Only head-to-head clinical data, read out against matched exposures and endpoints, can resolve which compound actually delivers the deepest and most durable benefit to patients.
Follow me on X for frequent updates (@chaotropy).
Legal Information and Disclosures
General Disclaimer & No Financial Advice: The content of this article is for informational and educational purposes only. It represents the personal opinions of the author as of the date of publication and may change without notice. The author is not a registered investment advisor or financial analyst. This content is not intended to be, and shall not be construed as, financial, legal, tax, or investment advice. It does not constitute a personal recommendation or an assessment of suitability for any specific investor. This article does not constitute an offer to sell, a solicitation of an offer to buy, or a recommendation of any security. Readers should conduct their own independent due diligence and consult with a certified financial professional before making any investment decisions. This article is not a securities research report and has not been prepared in accordance with legal requirements designed to promote the independence of investment research.
Medical Disclaimer: Although the author possesses a medical background, the information presented here regarding clinical trials, biochemical parameters, or pharmaceutical mechanisms is strictly for the purpose of educational discussion and general commentary regarding the underlying science. It does not constitute medical advice, a diagnosis, or a treatment recommendation, nor does it establish a physician-patient relationship. Readers should never disregard professional medical advice or delay in seeking it because of something read in this article. Always consult a qualified healthcare provider regarding any medical condition.
Computational Model Disclaimer: The kinetic simulation is a speculative modeling exercise restricted to non-covalent reversible occupancy-based KRAS G12D inhibitors, relying on published biochemical parameters where available and on estimates where not. Estimated values include plasma Cmax, plasma half-lives, molecular weights of undisclosed structures, drug residence times, and the drug-bound intrinsic hydrolysis fraction. All Cmax values are treated as free drug because no human protein-binding fraction is published for any of the four compounds. The 24-hour KRAS G12D protein half-life is estimated from wild-type cycloheximide chase data and the observation that G12D evades LZTR1-mediated turnover. The most load-bearing assumptions are the drug-bound exchange ratchet set to zero, which has empirical support for BBO-11818 from Stahlhut Fig 2K-L but rests on structural rationale for the other three compounds, and the reading of VS-7375 as a symmetric picomolar binder, drawn from a single abstract line without state-resolved SPR traces in the public record. If VS-7375's ON-state KD is in fact nanomolar rather than picomolar, the picture shifts substantially. The simulation does not model tissue distribution, tumor penetration, plasma protein binding, metabolite contributions, or the tumor microenvironment, and excludes covalent tri-complex inhibitors and protein degraders because their mechanisms are not captured by steady-state occupancy. The code has not been independently audited, peer-reviewed, or verified. The author holds long positions in three referenced companies (Verastem, BridgeBio Oncology Therapeutics, and Revolution Medicines). Verastem's VS-7375 and BridgeBio's BBO-11818 are included in the simulation, while Revolution Medicines' daraxonrasib and zoldonrasib are discussed narratively but excluded as covalent tri-complex inhibitors. This creates a potential for confirmation bias despite mitigation through actual-regimen dosing and symmetrical parameter treatment where state-resolved data are absent. Results are illustrative of mechanistic relationships, not quantitative predictions of clinical efficacy, tolerability, or competitive positioning. The model has not been validated against any completed clinical trial with known outcomes.
Accuracy and Third-Party Data: Clinical trial data, press releases, regulatory filings, and published literature referenced in this article are sourced from ClinicalTrials.gov, company press releases, peer-reviewed journals, and conference abstracts. While the author believes these sources to be reliable, the completeness, timeliness, or correctness of this data cannot be guaranteed. The author assumes no liability for errors, omissions, or the results obtained from the use of this information.
Disclosure of Interest: The author holds beneficial long positions in Revolution Medicines, Inc. (NASDAQ: RVMD), Verastem Oncology, Inc. (NASDAQ: VSTM) and BridgeBio Oncology Therapeutics (NASDAQ: BBOT). The author reserves the right to buy or sell these securities at any time without further notice. The author holds no position in GenFleet Therapeutics (Shanghai) Inc. (HKEX: 2595), Incyte Corporation (NASDAQ: INCY) or Jiangsu Hengrui Pharmaceuticals, or any other company referenced in this article. The author receives no direct compensation for the production of this content and maintains no business relationship with any of the companies mentioned. The author has no access to non-public preclinical data, clinical trial data, or internal company information. Readers should be aware that the author's financial interest in three of the companies referenced in this article creates a potential for confirmation bias in model design and interpretation, despite efforts to mitigate this through symmetrical parameter treatment and transparent disclosure of which parameter values are published and which are estimated.
Forward-Looking Statements & Risk: This article contains forward-looking statements regarding clinical trial outcomes, mechanism-based predictions, and competitive positioning in the KRAS G12D inhibitor space. These statements are based on speculative modeling and current publicly available information and are subject to significant risks and uncertainties. Actual clinical and commercial outcomes may differ materially. Investing in biotechnology and pharmaceutical securities involves a high degree of risk, including the potential for total loss of principal. Past performance is not indicative of future results. No reader should rely on this article as a basis for any investment decision. The author has no obligation to update this article if new information becomes available or if the author's position changes.
Copyright: All original content, including text, simulation code, and figures, is the property of the author and may not be copied, reproduced, or published, in whole or in part, without prior written consent, except as permitted by applicable law or the terms of the platform on which it is published. Use of this content for training machine learning or AI models is not permitted without explicit authorization. Third-party or public domain images remain subject to their respective rights and are not claimed as the author's property.


