Pharmacokinetic Simulation Of Tenax's Oral Levosimendan Suggests Higher Drug Exposure Than IV Dosing In PH-HFpEF
A computational five-compartment pharmacokinetic model built on published parameters suggests that daily oral levosimendan delivers higher and substantially more stable free drug exposure than the weekly IV infusions behind the significant 6MWD improvement in Phase 2.

Disclosure: The author holds a beneficial long position in Tenax Therapeutics, Inc. (NASDAQ: TENX). This article is provided for informational and educational purposes only and is not financial advice. The pharmacokinetic model presented here is a speculative theoretical exercise built on published population-level PK parameters and class-level pharmacology, not direct measurements from the LEVEL Phase 3 trial. It cannot reliably predict the outcome of any real-world study. Although the author is a Medical Doctor, this content represents a personal analytical perspective on the company’s science and does not constitute medical advice, a diagnosis, or a treatment recommendation. The author receives no compensation for this article and has no business relationship with the company mentioned. Please see the full “Legal Information and Disclosures” section below. This article has not been independently peer-reviewed. The pharmacokinetic model is a speculative theoretical exercise and should be evaluated critically.
Pulmonary hypertension associated with heart failure with preserved ejection fraction (PH-HFpEF) is among the most common and lethal forms of pulmonary hypertension, with no approved therapy. Prevalence among HFpEF patients ranges from 36 to 83% depending on the study and diagnostic method, and five-year mortality is approximately 52%, significantly worse than heart failure without pulmonary hypertension. An American Heart Association Science Advisory described it as “a growing epidemic with high morbidity and mortality and no treatment” (Brittain et al., Circulation, 2022). Every prior attempt to repurpose approved pulmonary vasodilators for this population has failed in clinical trials, which is unsurprising given that the pathophysiology is fundamentally different from Group 1 PH: it starts with elevated left-sided filling pressures, which propagate backward through the pulmonary vasculature, eventually causing structural remodeling and right ventricular dysfunction.
Levosimendan was discovered and developed in the 1990s by Orion Corporation in Finland as an intravenous treatment for acutely decompensated heart failure, approved in approximately 60 countries but never available in the United States. The drug has a unique triple mechanism of action: it sensitizes cardiac myofilaments to calcium by binding troponin C (increasing contractile force without raising intracellular calcium), it activates ATP-sensitive potassium channels in vascular smooth muscle (causing vasodilation of arterial, venous, and coronary vessels), and it inhibits phosphodiesterase-3. In patients with HFpEF, however, Tenax Therapeutics' Phase 2 HELP study suggested that the dominant mechanism is not calcium sensitization but rather K-ATP channel-mediated vasodilation: the trial showed significant reductions in filling pressures without changes in cardiac output, consistent with venodilation reducing preload and stressed blood volume rather than enhancing contractility.
The HELP trial enrolled 44 patients with PH-HFpEF defined by mPAP of at least 35 mmHg and PCWP of at least 20 mmHg, all NYHA class II or III. In the open-label lead-in, a 24-hour intravenous levosimendan infusion at 0.1 μg/kg/min produced hemodynamic responses in 37 of 44 patients (84%), defined as at least a 4 mmHg reduction in exercise pulmonary capillary wedge pressure. Those responders were randomized to weekly 24-hour infusions or placebo for five additional weeks. The primary endpoint of exercise-PCWP did not reach significance (-1.4 mmHg, p=0.65), but PCWP measured across all exercise stages was significantly reduced (-3.9 mmHg, p=0.047), and six-minute walk distance improved by 29.3 meters compared to placebo (p=0.033). It was the first randomized controlled trial in PH-HFpEF to show a statistically significant improvement in exercise capacity (Burkhoff et al., JACC Heart Fail 2021).
Those results came from intravenous dosing, and the question facing Tenax as it moved into Phase 3 was whether an oral formulation could replicate the hemodynamic effects of weekly 24-hour infusions. This is not a trivial pharmacokinetic translation. Levosimendan's parent drug has an elimination half-life of approximately one to 1.5 hours in the literature (the model's two-compartment parameters yield a terminal half-life of about 1.25 hours and a distribution half-life of about 0.4 hours, well within this range), and after an IV infusion ends, parent drug falls below pharmacologically relevant concentrations within approximately 6 hours. Yet the hemodynamic effects of a single 24-hour infusion persist for days afterward, as demonstrated by Kivikko et al. (Circulation, 2002), who showed sustained hemodynamic improvement for at least 24 hours after discontinuation. This prolonged action is driven largely by OR-1896, an active metabolite with an elimination half-life of approximately 80 hours in heart failure patients.
The metabolic pathway from levosimendan to OR-1896 is unusual and depends on intestinal bacteria regardless of the route of administration. When given orally, a small fraction of the absorbed dose (roughly 6% in the model) is reduced directly by anaerobic bacteria in the gut lumen to an amino phenylpyridazinone metabolite called OR-1855 before the parent drug is even absorbed. When given intravenously, circulating levosimendan is taken up by the liver and excreted into bile, which drains back into the small intestine where the same bacterial reduction produces OR-1855. This biliary pathway also operates after oral dosing, supplementing the direct gut conversion, but it is the sole route for IV-administered drug. In both cases, OR-1855 is reabsorbed and acetylated by N-acetyltransferase 2 (NAT2) to produce OR-1896. The combined pathway accounts for only about 4 to 5% of total levosimendan metabolism; most of the parent drug is conjugated with glutathione and eliminated. But because OR-1896 is pharmacologically active and has a half-life more than 50 times longer, even that small fractional conversion produces clinically meaningful metabolite accumulation.
OR-1896’s pharmacological significance is amplified by its protein binding profile. The parent drug is 97 to 98% plasma protein bound, leaving only 2 to 3% as free drug (Sandell et al. 1995). OR-1896 is only about 40% protein bound, giving it a free fraction of approximately 60%. This 24-fold difference in free fraction means that at equal total plasma concentrations, OR-1896 delivers far more pharmacologically active drug to target tissues than the parent compound.
The NAT2 enzyme that converts OR-1855 to OR-1896 is polymorphically distributed in the population. Rapid acetylators (roughly half of Caucasians) produce about 3.5-fold higher OR-1896 AUC than slow acetylators after a single IV infusion (Antila et al. 2004). Despite this pharmacokinetic difference, the hemodynamic effects appear similar between the two phenotypes (Kivikko et al. 2010), suggesting that both groups achieve pharmacologically relevant metabolite levels.
With this background, the question becomes quantitative: under the LEVEL Phase 3 oral dosing regimen (TNX-103, given as 2 mg/day for weeks 1 to 4, then 3 mg/day for weeks 5 to 12, administered three times daily), what plasma concentrations of parent drug and OR-1896 does the model predict at steady state, and how do those concentrations compare to what the HELP trial’s weekly IV infusions achieved?
To explore this, I built a pharmacokinetic simulation in Python. As with my previous computational exercise on Palisade Bio’s PALI-2108, I want to be upfront: this is a theoretical exercise. The model relies on published population PK parameters, not individual patient data from the LEVEL trial. It can suggest plausible concentration ranges and highlight which variables matter most, but it cannot predict what the LEVEL trial will show. Every number that follows should be read with that caveat firmly in mind.
The model uses a five-compartment ordinary differential equation system (ODE) solved numerically via scipy’s LSODA integrator. Levosimendan’s parent drug is represented by a two-compartment disposition model (central volume 16.8 L, peripheral volume 4.0 L, intercompartmental clearance 5.0 L/h, systemic clearance 13.3 L/h), reflecting the rapid tissue distribution phase that a one-compartment model would miss. Oral absorption follows first-order kinetics with a rate constant of 2.0 per hour, giving a Tmax of roughly 30 to 45 minutes, consistent with published data showing peak concentrations within an hour (Sundberg 1998). Bioavailability is set at 85%, well-established in both healthy volunteers and HF patients (Sandell et al. 1995).
The model explicitly tracks OR-1855 as a distinct intermediate compartment, following the metabolic pathway described above. OR-1896 is modeled with a volume of distribution of 176 L and an elimination half-life of 80 hours in heart failure patients (Antila et al. 2004), giving a clearance of approximately 1.5 L/h derived directly from those two parameters rather than set independently. NAT2 acetylation rates are 0.08 per hour (rapid) and 0.023 per hour (slow) per Antila et al. 2004.
The model represents the biliary excretion pathway as a first-order systemic formation rate constant (k_form), which collapses what is in reality a multi-step process (hepatic uptake, biliary secretion, intestinal transit, bacterial reduction, and reabsorption) into a single rate. This is a standard simplification in compartmental PK modeling but means the model does not capture the transit time delay inherent in the enterohepatic loop. The IV formation rate constant (k_form_iv = 0.02 h⁻¹) is set 4-fold higher than the oral value (k_form_oral = 0.005 h⁻¹), reflecting that biliary excretion is the sole route to OR-1855 for IV-administered drug, whereas oral dosing has direct gut conversion as its dominant pathway. These formation rate constants are among the model’s least constrained parameters; no published PK analysis reports them directly, and they were selected to produce OR-1896 accumulation consistent with the magnitude observed clinically. A sensitivity analysis varying these and other key parameters is presented in Figure 4.
For intravenous dosing, the parent drug reaches steady state during a 24-hour infusion at approximately 27 ng/mL at 0.075 μg/kg/min, or approximately 35 ng/mL at 0.1 μg/kg/min, based on the systemic clearance and the infusion rate for an 80 kg patient. The HELP protocol allowed maintenance infusions between 0.075 and 0.1 μg/kg/min; the model uses the lower bound (0.075 μg/kg/min) for all post-initial infusions, which produces a conservative estimate of IV metabolite accumulation and therefore a liberal estimate of the oral/IV exposure ratio.
The primary results presented below use rapid-acetylator parameters, representing approximately 55% of the Caucasian population. Slow-acetylator results are presented alongside for context, and a population-weighted estimate is provided. For all multi-week simulations, both IV and oral regimens are run for 12 weeks to enable a direct pharmacokinetic comparison. It should be noted that the HELP trial’s randomized phase lasted six weeks (one open-label lead-in plus five randomized), not twelve; the 12-week IV simulation is an extrapolation used solely as a steady-state comparator. Because IV OR-1896 reaches steady state by approximately week 3 to 4, this extrapolation is not expected to alter the steady-state concentrations used in the comparison.
Figure 1 shows the single-dose pharmacokinetic profiles comparing a 24-hour IV infusion at the initial rate (0.1 μg/kg/min) with a single 1 mg oral dose, both simulated through the full five-compartment ODE. The IV infusion sustains parent concentrations around 35 ng/mL for the entire infusion duration, while the oral dose produces a brief peak at about 24 ng/mL followed by near-complete elimination within approximately 6 hours. The right panel reveals the critical difference: the sustained 24-hour parent exposure under IV dosing continuously feeds the intestinal metabolic pathway via biliary excretion, generating substantially more OR-1896 per dose than the fleeting oral bolus. This is why continuous oral dosing three times daily is essential: the parent drug’s pharmacokinetic contribution at any single time point is modest, but the cumulative metabolite production across all three daily doses, accumulated over days to weeks, builds to pharmacologically relevant OR-1896 levels.
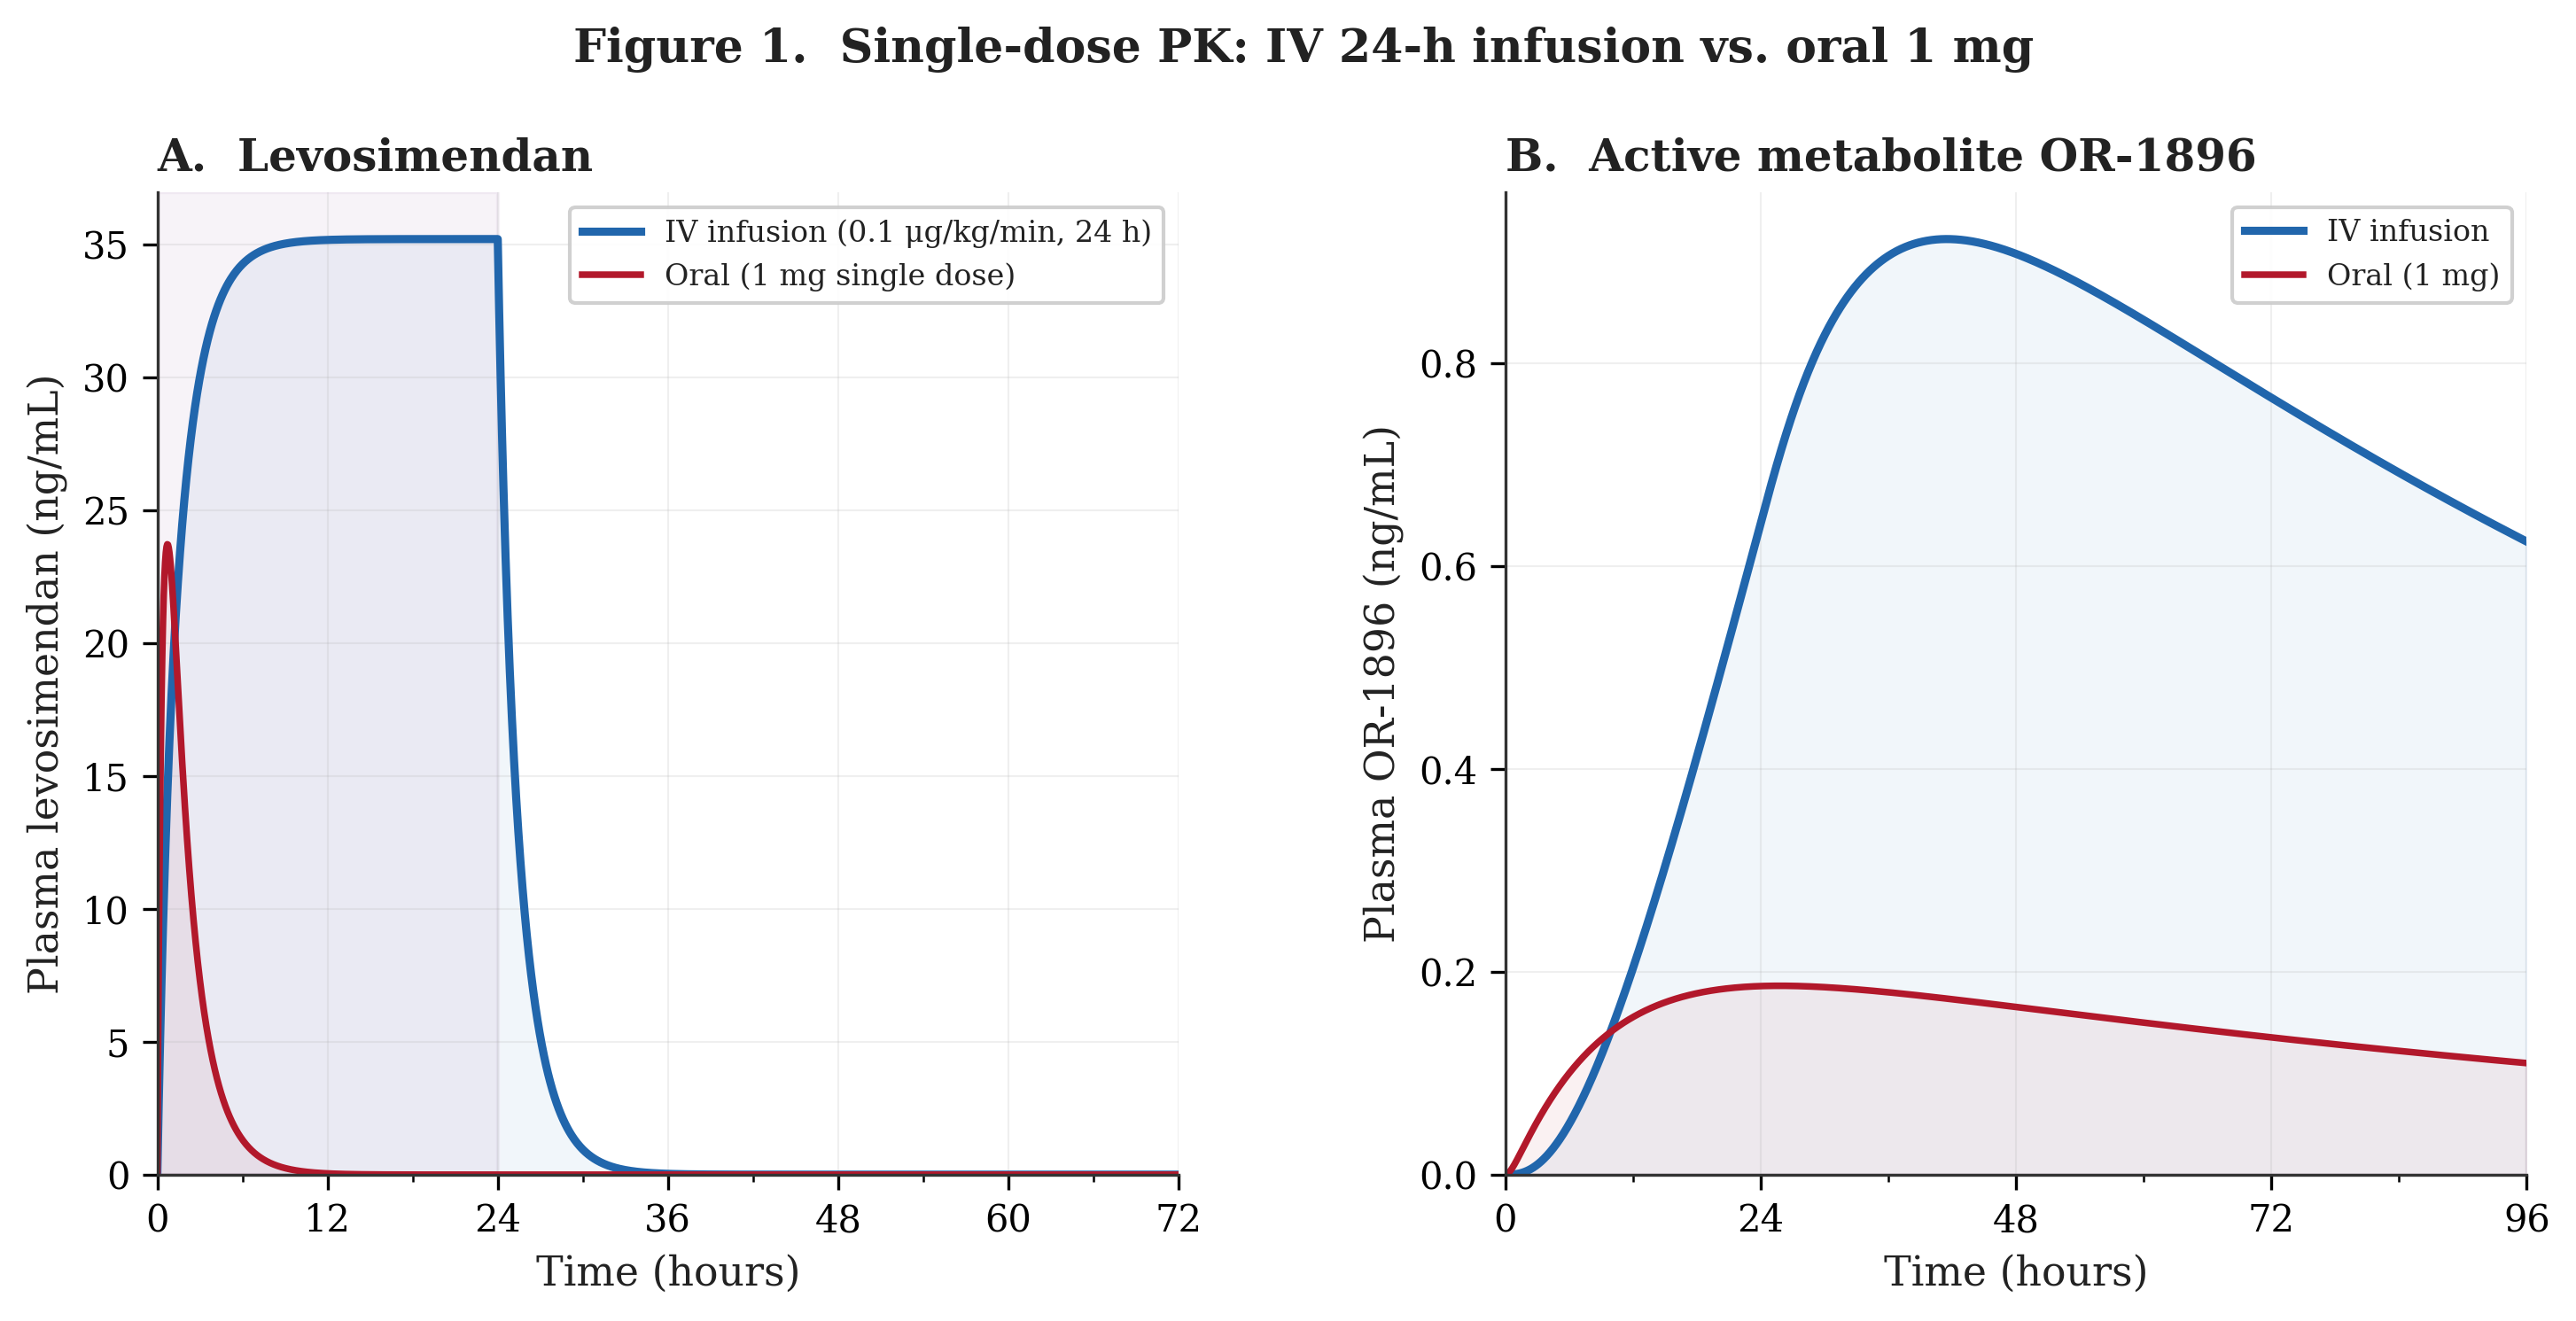
Figure 2 presents OR-1896 accumulation over 12 weeks of chronic dosing under both regimens (rapid acetylator). The daily-averaged metabolite concentration is plotted to show the underlying trend without the noise of within-day parent drug oscillations. Under IV weekly dosing, OR-1896 cycles with each 24-hour infusion, rising after the infusion and then partially washing out over the following six days, producing a repeating sawtooth pattern that reaches a time-averaged steady state of approximately 0.6 ng/mL. Under oral three times daily dosing, the metabolite builds steadily because three daily doses feed the metabolic pathway more continuously. After the uptitration from 2 mg/day to 3 mg/day at week 4, the oral metabolite curve inflects upward and approaches a smooth steady state of approximately 3.3 ng/mL by about week 6 to 8.
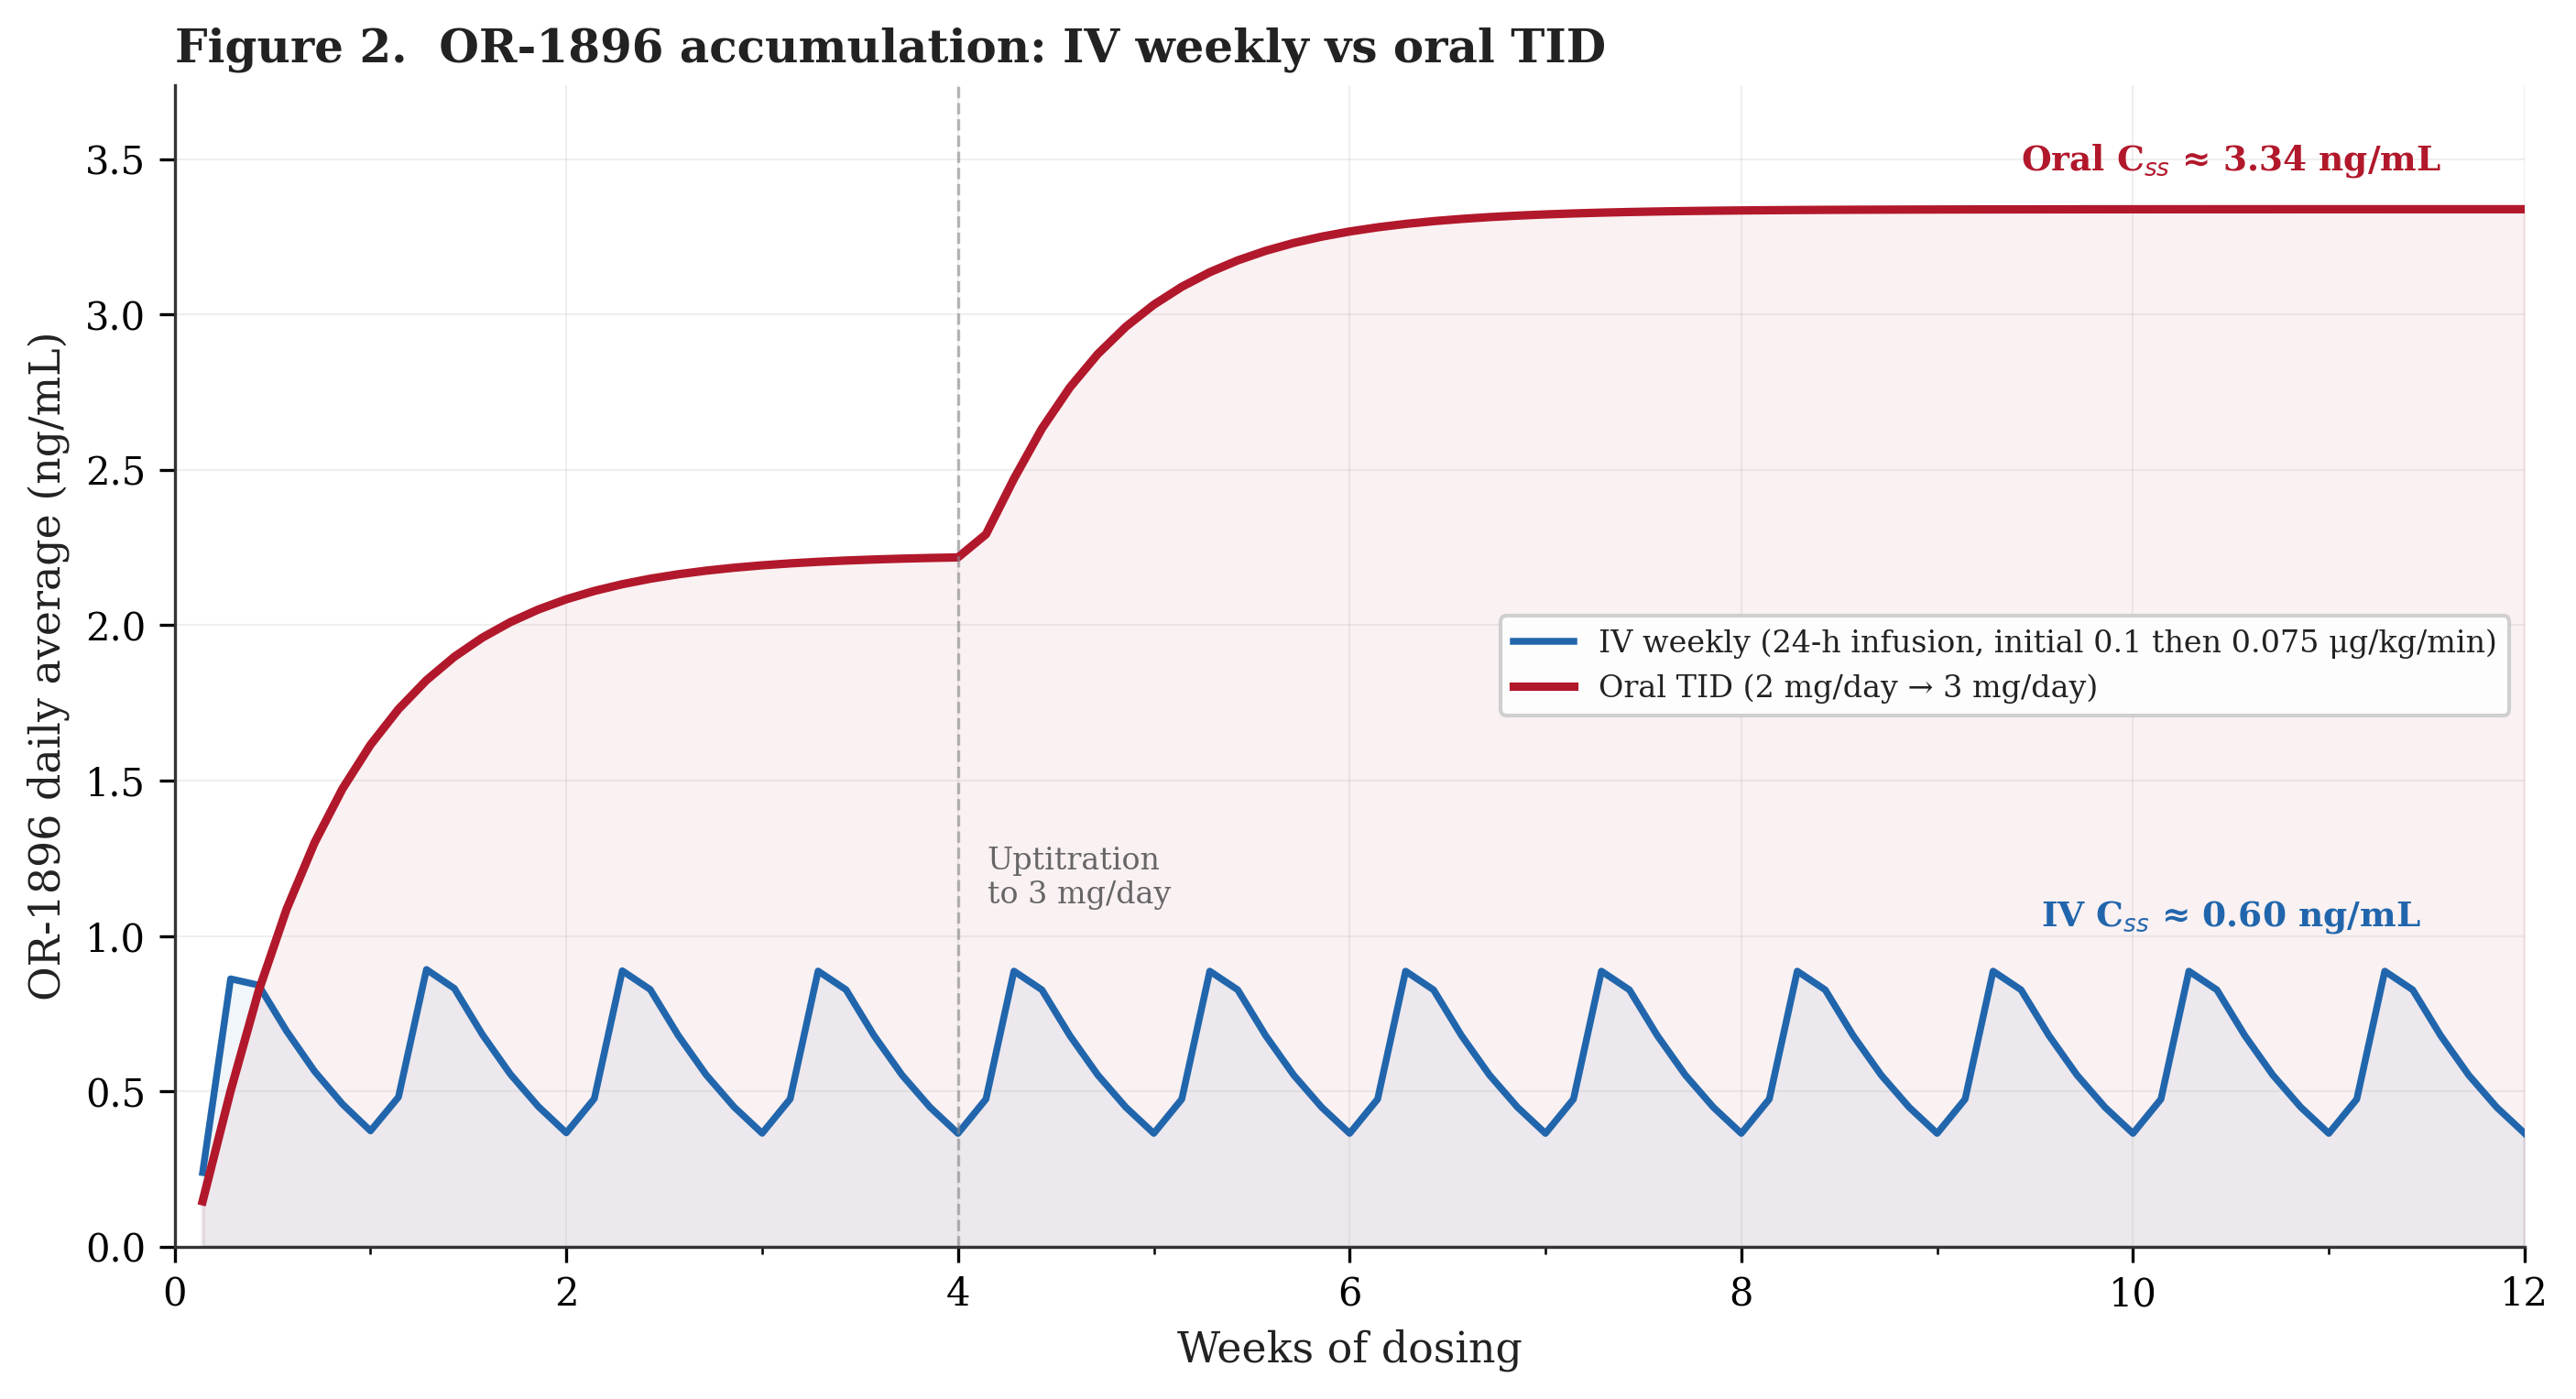
In the model, the oral regimen achieves markedly higher average metabolite concentrations than IV weekly. The explanation follows from the dosing arithmetic: three daily doses feed the metabolic pathway continuously, while IV weekly delivers a single 24-hour bolus once every seven days. With an 80-hour metabolite half-life, daily oral dosing produces sustained input that accumulates without fully washing out between doses. The IV regimen, by contrast, allows nearly complete metabolite washout during the six-day gap between infusions (the half-life is just over three days, so by day 7 the metabolite has fallen by roughly 70% from its post-infusion peak). Oral dosing also delivers more total systemic drug per week: approximately 17.9 mg absorbed (21 mg/week at 85% bioavailability) versus approximately 8.6 mg per weekly IV infusion at the maintenance rate of 0.075 μg/kg/min for an 80 kg patient. Yet the roughly 5.5-fold difference in steady-state OR-1896 appears disproportionate to this roughly 2.1-fold difference in systemic exposure, suggesting that it is the frequency and continuity of metabolic pathway feeding, not simply the total dose, that drives metabolite accumulation.
Figure 3 illustrates what I consider the model’s most important finding. It shows the free effective concentration during the final dosing week for both regimens at steady state (rapid acetylator). The free effective concentration is defined as the sum of free parent drug (total parent times 2.5% unbound fraction) and free OR-1896 (total metabolite times 60% unbound fraction). Under the equi-potency assumption, OR-1896 contributes disproportionately to the effective concentration because of its high free fraction. At oral steady state, OR-1896 accounts for approximately 92% of the total free effective concentration.
This Ceff metric assumes equi-potency of parent and OR-1896 on a free-concentration basis. Because OR-1896 accounts for approximately 92% of the oral regimen's Ceff but contributes less to the IV regimen's Ceff (where parent drug dominates during the infusion window), the oral/IV ratio is sensitive to this assumption: if OR-1896 is less potent than parent per unit free concentration, the effective ratio would be lower than stated; if more potent, higher. That said, the HELP trial's sustained hemodynamic effects persisted days after parent drug clearance, suggesting that both regimens' clinical activity at steady state is predominantly OR-1896-mediated.
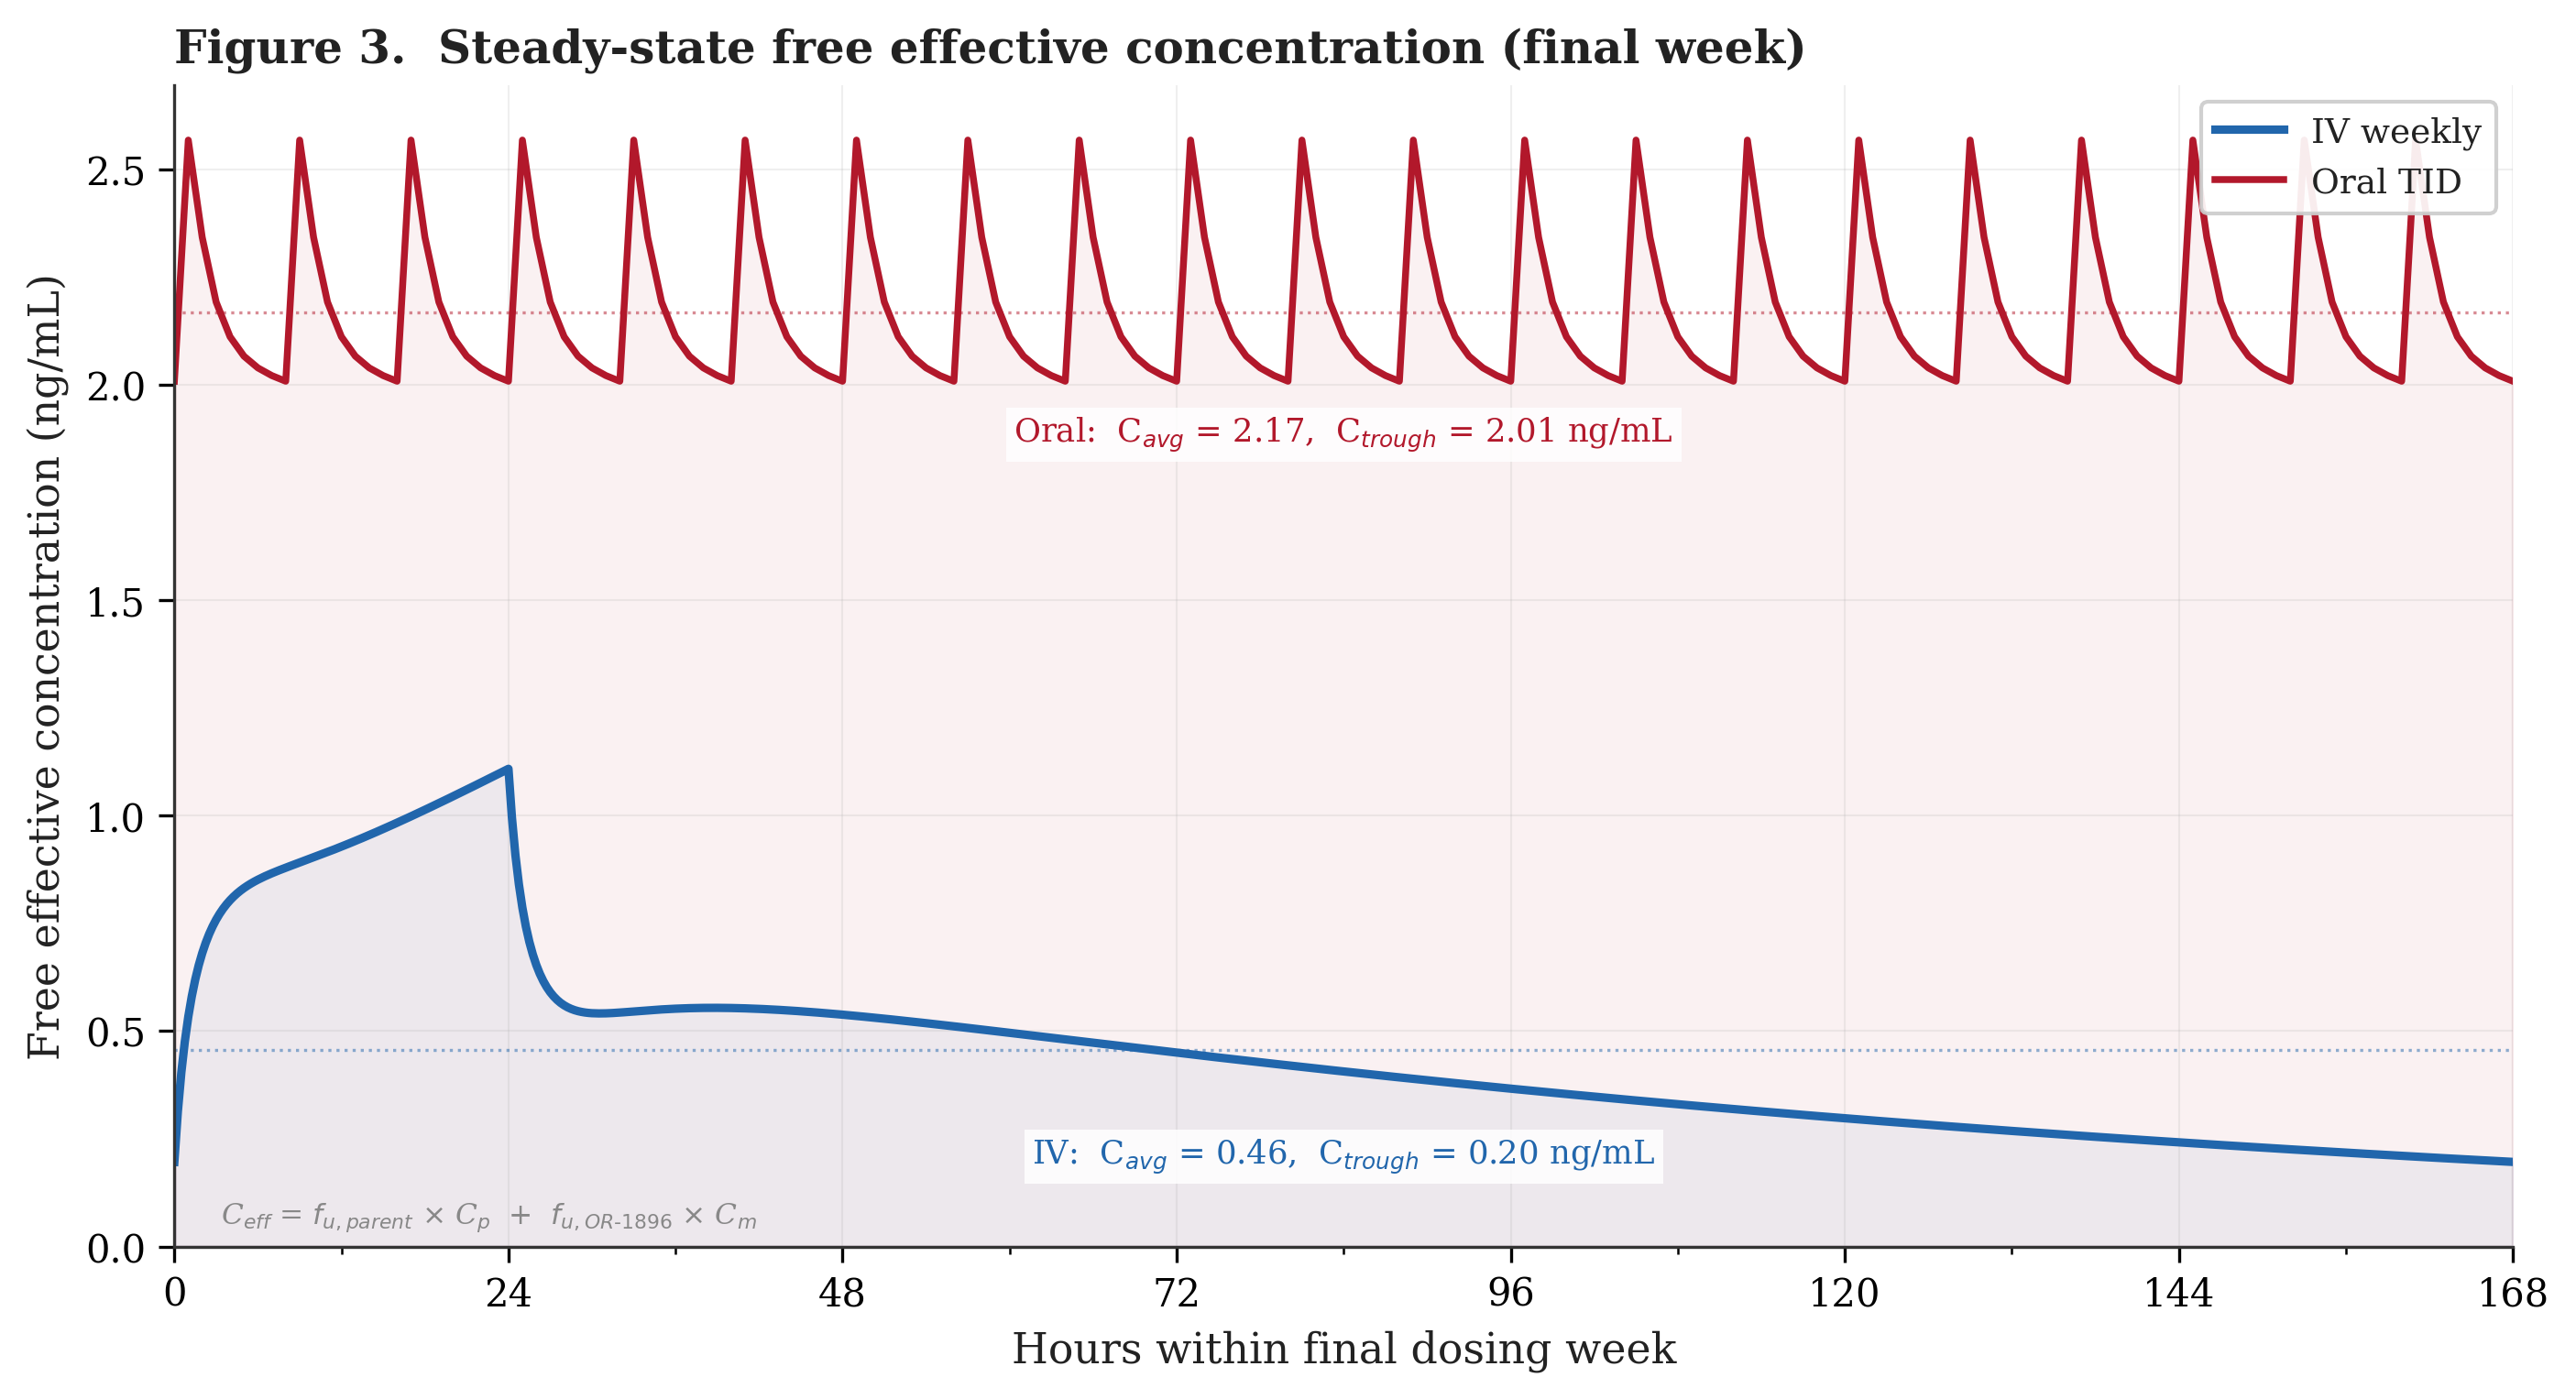
The IV weekly profile spikes to approximately 1.1 ng/mL during the 24-hour infusion but then decays steadily as the parent drug clears and OR-1896 washes out, falling to approximately 0.2 ng/mL by day 7. The oral three times daily profile fluctuates modestly with each 8-hour dose but maintains troughs above 2.0 ng/mL throughout the entire week. The oral trough concentration (the lowest point in the dosing cycle) exceeds the IV peak concentration (the highest point). In the simulation, at no moment during the week does the oral regimen deliver less free drug than the IV regimen delivers at its best. The time-averaged free effective concentration is approximately 2.17 ng/mL for oral versus 0.46 ng/mL for IV, a roughly 4.7-fold increase. These values reflect rapid acetylators. For slow acetylators, the model predicts an oral Ceff of approximately 1.36 ng/mL (3.0-fold over IV). Weighting by a representative Caucasian NAT2 distribution (55% rapid, 45% slow), the population-averaged oral Ceff is approximately 1.80 ng/mL, or roughly 4.0-fold over IV. Importantly, even the slow-acetylator trough (approximately 1.2 ng/mL) exceeds the IV peak, so the qualitative conclusion holds across both phenotypes.
This consistency of exposure may be pharmacologically significant. The vascular remodeling that characterizes PH-HFpEF is a continuous process driven by sustained hemodynamic stress. Intermittent drug exposure, with potent vasodilation during infusion followed by days of near-complete washout, may produce less durable vascular benefit than continuous vasodilation. The oral regimen, by maintaining steadier drug levels, may deliver more consistent hemodynamic support. Open-label extension data from the HELP study showed that patients transitioned to oral dosing had higher blood levels of OR-1896 compared to the IV study, along with improvements in KCCQ, BNP reductions exceeding 20%, and six-minute walk improvements once patients reached 3 mg (Thenappan et al., Journal of Cardiac Failure, 2023). These uncontrolled observations are consistent with the model’s prediction that oral dosing achieves higher metabolite exposure.
The clinical inference follows qualitatively from the pharmacokinetics: if weekly IV levosimendan at a time-averaged Ceff of 0.46 ng/mL produced statistically significant improvements in PCWP and 6MWD in the HELP trial, then a regimen that could deliver 4.0- to 4.7-fold higher (population-weighted to rapid-acetylator range) and substantially more stable exposure might produce at least comparable clinical benefit, provided the exposure-response relationship does not plateau, reverse, or encounter safety limitations at the higher concentration.
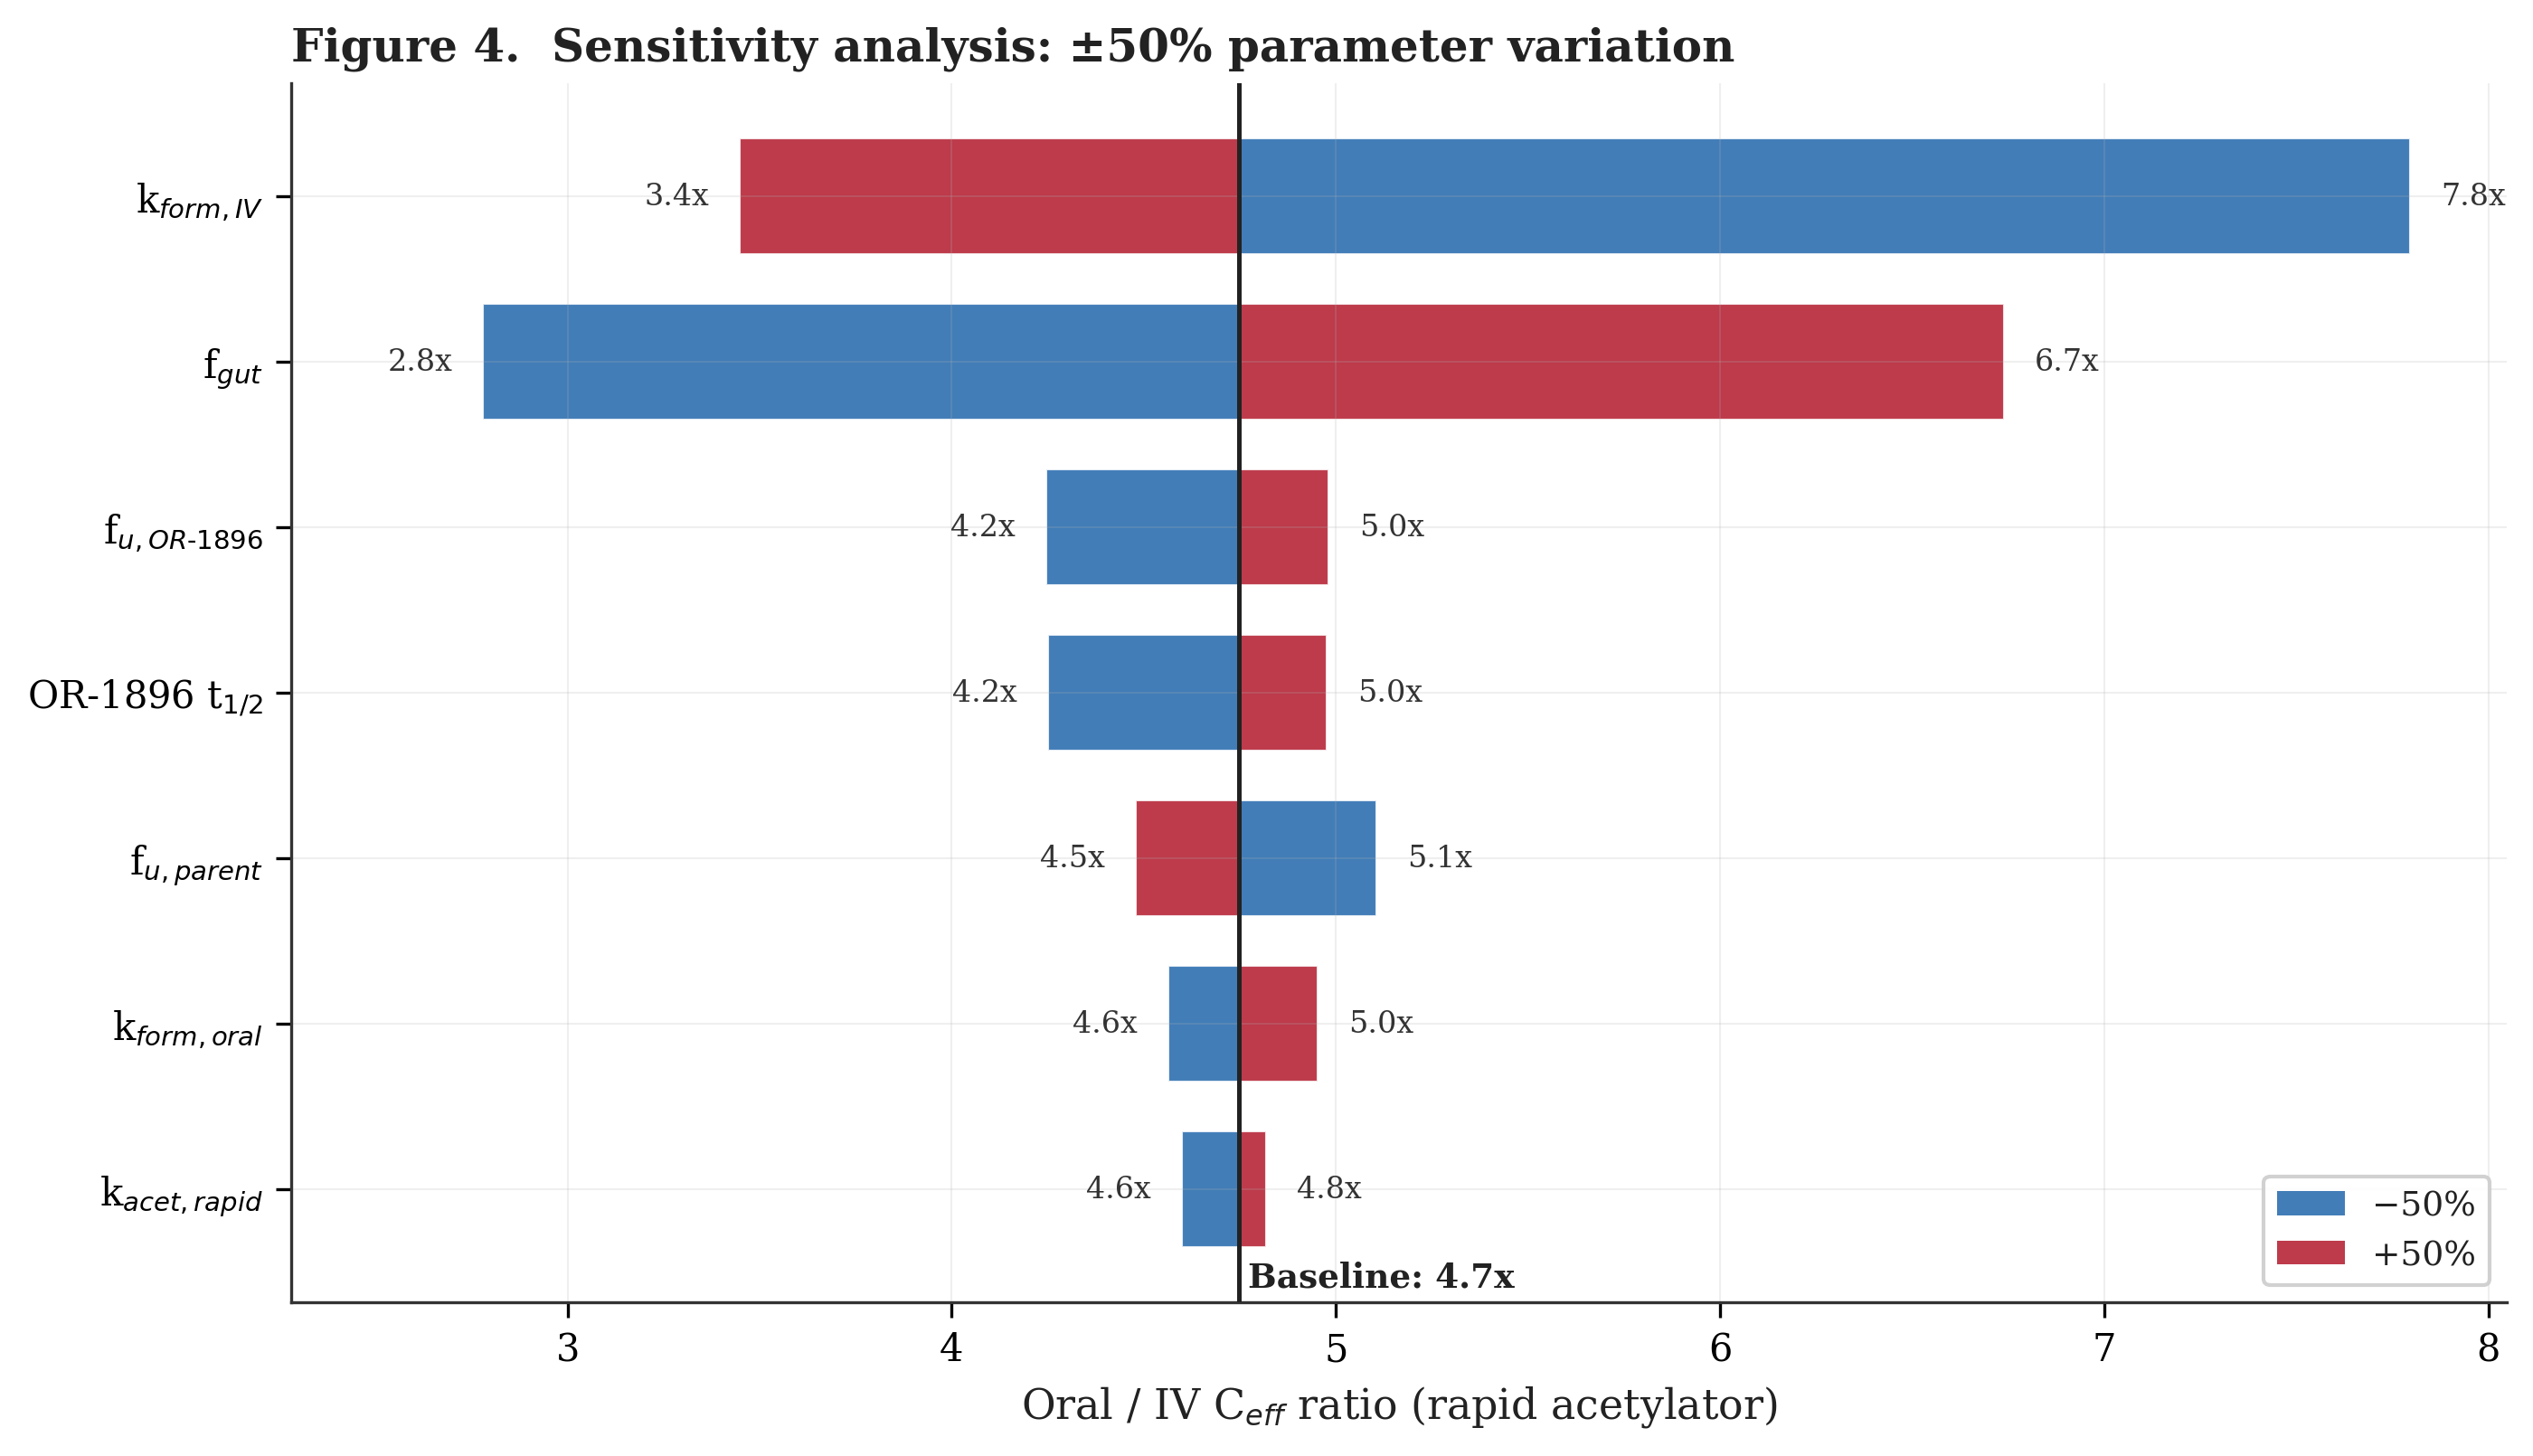
Figure 4 presents a tornado-style sensitivity analysis examining how the oral/IV Ceff ratio changes when each key model parameter is varied by plus or minus 50% from its baseline value. The two least constrained parameters, k_form_iv (the IV-route systemic formation rate constant) and f_gut (the fraction of the absorbed dose converted to OR-1855 in the gut), produce the widest swings (3.4x to 7.8x and 2.8x to 6.7x respectively), as they directly control how much OR-1896 each regimen produces. All other parameters shift the ratio by less than one-fold. Across all single-parameter perturbations, the oral/IV ratio remains above 2x. Simultaneous adverse shifts in multiple parameters (for example, higher k_form_iv combined with lower f_gut) could reduce the ratio further, though the qualitative direction of the oral advantage would likely persist.
Interpreting this PK bridge between Phase 2 and Phase 3 requires understanding the differences between the two trial populations. The HELP trial used strict hemodynamic entry criteria (mPAP ≥35 mmHg, PCWP ≥20 mmHg), enrolled only NYHA class II–III patients, and critically employed a responder enrichment design: only the 37 of 44 patients (84%) who demonstrated at least a 4 mmHg acute reduction in exercise PCWP during the open-label lead-in were randomized.
The LEVEL study is a Phase 3, double-blind, randomized, placebo-controlled trial of TNX-103 in patients with PH-HFpEF. 230 patients have been randomized 1:1 to oral levosimendan or placebo, with dosing at 2 mg/day (weeks 1 to 4) and 3 mg/day (weeks 5 to 12). The primary endpoint is change from baseline in 6-minute walk distance at Week 12. A prespecified blinded sample size re-estimation conducted after approximately two-thirds of patients had been randomized confirmed that the observed standard deviation in 6MWD change was less than the assumed 55 meters, and the trial is powered at over 90% to detect a 25-meter treatment effect (Tenax press release, December 17, 2025). The company announced in March 2026 that randomization of 230 patients is complete and screening has closed, with topline data expected in the third quarter of 2026 (Tenax press release, March 10, 2026). A second registrational trial, LEVEL-2, has been initiated globally and plans to enroll approximately 540 patients, randomized 2:1 to TNX-103 or placebo, with a primary endpoint of 6MWD change at Week 26. The model suggests that OR-1896 reaches steady state by about week 6 to 8, meaning the LEVEL Week 12 assessment should capture near-maximal pharmacological effect, while the LEVEL-2 Week 26 endpoint should reflect full pharmacological equilibrium.
Critically, the LEVEL trial (Yaku et al., Journal of Cardiac Failure, 2025) enrolls under substantially broader hemodynamic thresholds than HELP, includes ambulatory NYHA class IV patients, employs no responder enrichment step, and requires qualifying 6MWD between 100 and 450 meters. The LEVEL population is therefore more heterogeneous than HELP's, encompassing both milder resting hemodynamics and more advanced functional limitation. Because HELP randomized only proven hemodynamic responders while LEVEL does not pre-select for acute levosimendan response, the Phase 2 treatment effect cannot be directly extrapolated. The pharmacokinetic analysis presented here addresses only one dimension of this bridge: it suggests that the oral regimen delivers higher and more stable drug exposure than the IV regimen. Whether the broader LEVEL population responds to that exposure with comparable hemodynamic and functional improvements is a question that only the Phase 3 data can answer.
Model limitations deserve emphasis. The two-compartment parent PK model captures rapid distribution, the explicit OR-1855 intermediate compartment models the actual metabolic pathway, and OR-1896 clearance is derived from half-life and volume of distribution rather than set independently, ensuring internal consistency. Nevertheless, the model has significant limitations.
The effective concentration metric treats parent and OR-1896 as equi-potent on a free-concentration basis. While both compounds are pharmacologically active at the same targets, their relative in vivo potencies have not been precisely quantified. If the potency ratio differs from unity, the Ceff values and the oral/IV ratio would shift accordingly.
The biliary excretion pathway is collapsed to a single first-order rate constant, omitting transit delays that may affect single-dose temporal profiles but are less consequential at steady state. Bioavailability is applied before the gut lumen split, slightly underestimating direct gut conversion (~15%) with minimal effect on total OR-1896 production (~1 percentage point).
The model's NAT2 rapid/slow acetylator OR-1896 ratio is approximately 1.7-fold, whereas Antila et al. (2004) reported approximately 3.5-fold in healthy volunteers after a single IV infusion. This discrepancy is structural: reproducing the 3.5x ratio would require a much larger OR-1855 elimination rate constant, which would simultaneously reduce total OR-1896 production below observed clinical levels. The real biology likely involves complexities not captured here, including bidirectional OR-1855/OR-1896 interconversion and potentially non-linear gut bacterial reduction kinetics. The practical consequence is that rapid-acetylator results represent the upper range of expected OR-1896 exposure, while slow-acetylator levels in vivo may be lower than shown. The population-weighted estimate (Ceff approximately 1.80 ng/mL, or 4.0-fold over IV) is presented as a more representative central tendency.
The model does not account for drug-drug interactions, the effect of heart failure severity on PK parameters, or the full distribution of NAT2 acetylator phenotypes (including intermediate acetylators). OR-1855's volume of distribution is assumed equal to OR-1896's at 176 L, as no published data exist. The simulation assumes linear pharmacokinetics at the 2 to 3 mg/day dose range, supported by published literature but not confirmed in the LEVEL population specifically.
The scientific rationale behind levosimendan in PH-HFpEF is compelling: a drug with a credible mechanism of action in a disease defined by excessive preload and venous congestion, with no approved therapy and a five-year mortality exceeding 50%. The Phase 2 data showed statistically significant improvements in exercise capacity and hemodynamics. The pharmacokinetic analysis presented here suggests that oral three times daily dosing achieves substantially higher and more stable OR-1896 exposure than IV weekly dosing, driven by the continuous feeding of the metabolic pathway and the metabolite’s long half-life. The sensitivity analysis (Fig. 4) confirms that the oral regimen’s pharmacokinetic advantage predicted by the model is robust across a wide range of parameter assumptions, with the oral/IV Ceff ratio remaining above 2x even under the most conservative single-parameter perturbations. In the model, across rapid acetylators, slow acetylators, and the population-weighted average, the oral regimen’s trough free effective concentration exceeds the IV regimen’s peak, suggesting a qualitatively robust pharmacokinetic advantage regardless of NAT2 phenotype. Whether that pharmacokinetic advantage translates into a clinically meaningful treatment effect in the broader LEVEL population will be determined by the ongoing Phase 3 trials.
The model is designed to answer a fundamental question: does the switch from weekly intravenous infusions to daily oral dosing sacrifice drug exposure, or does it potentially increase it? The intuition that intravenous administration is pharmacologically stronger than oral dosing is deeply ingrained, and for most drugs that intuition is correct. But levosimendan's clinical effect at steady state is driven not by the parent compound, which is cleared within hours regardless of route, but by a long-lived active metabolite whose production depends on how frequently the metabolic pathway is fed. In this unusual pharmacokinetic situation, daily oral dosing's apparent disadvantage (lower peak parent concentrations) appears to be more than offset by its ability to supply the metabolic pipeline continuously rather than in weekly pulses. The specific numbers the model produces are uncertain. However, the results point in the direction of oral dosing favoring metabolite accumulation.
Follow me on X for frequent updates (@chaotropy).
Legal Information and Disclosures
General Disclaimer & No Financial Advice: The content of this article is for informational and educational purposes only. It has not been independently peer-reviewed or audited. It represents the personal opinions of the author as of the date of publication and may change without notice. The author is not a registered investment advisor or financial analyst. This content is not intended to be, and shall not be construed as, financial, legal, tax, or investment advice. It does not constitute a personal recommendation or an assessment of suitability for any specific investor. This article does not constitute an offer to sell, a solicitation of an offer to buy, or a recommendation of any security. Readers should conduct their own independent due diligence and consult with a certified financial professional before making any investment decisions. This article is not a securities research report and has not been prepared in accordance with legal requirements designed to promote the independence of investment research.
Medical Disclaimer: Although the author is a Medical Doctor, the information presented here regarding medical technologies, clinical trials, or pharmaceutical mechanisms is strictly for the purpose of educational discussion and general commentary regarding the underlying science. It does not constitute medical advice, a diagnosis, or a treatment recommendation, nor does it establish a physician-patient relationship. Readers should never disregard professional medical advice or delay in seeking it because of something read on this website. Always consult a qualified healthcare provider regarding any medical condition.
Computational Model Disclaimer: The pharmacokinetic model presented in this article is a speculative theoretical exercise. It relies on published population PK parameters and class-level pharmacological assumptions rather than direct measurements from the LEVEL Phase 3 trial. Many inputs (including metabolite formation rates, protein binding fractions, and volume of distribution for OR-1855) are approximated from literature on related formulations or inferred indirectly. The systemic formation rate constants (k_form_oral, k_form_iv) that govern biliary-route metabolite production are among the model’s least constrained parameters; they are not reported directly in any published PK analysis and were selected to produce clinically plausible OR-1896 accumulation. The model’s NAT2 rapid/slow ratio (~1.7x) underestimates the observed ratio (~3.5x; Antila et al. 2004) due to structural limitations discussed in the text. The simulation code has not been independently audited, peer-reviewed, or verified by a third party. Bugs in the implementation could alter results materially. The model’s outputs should be understood as order-of-magnitude estimates illustrating relative trends, not as quantitative predictions of drug exposure in any individual patient or clinical trial. Independent replication with alternative parameter assumptions is encouraged.
Accuracy and Third-Party Data: Clinical trial data, press releases, regulatory filings, and published literature referenced in this article are sourced from ClinicalTrials.gov, Tenax Therapeutics investor relations, peer-reviewed journals, and conference abstracts. While the author believes these sources to be reliable, the completeness, timeliness, or correctness of this data cannot be guaranteed.
Disclosure of Interest: The author holds a beneficial long position in Tenax Therapeutics, Inc. (NASDAQ: TENX). The author reserves the right to buy or sell these securities at any time without further notice. The author receives no direct compensation for the production of this content and maintains no business relationship with the company. The author has no access to non-public trial data, unblinded interim results, or internal company information. Readers should be aware that the author’s financial interest in the company creates a potential for confirmation bias in model design and interpretation, despite efforts to mitigate this through systematic analysis and the inclusion of conservative assumptions. Independent replication of the model with alternative assumptions is encouraged.
Forward-Looking Statements & Risk: This article contains forward-looking statements regarding regulatory outcomes, clinical results, and market potential. These statements are predictions based on current expectations and are subject to significant risks and uncertainties. Actual results may differ materially. The LEVEL trial has completed enrollment but remains blinded; unblinded results could differ substantially from any model prediction presented here. Investing in biotechnology and pharmaceutical securities involves a high degree of risk, including the potential for total loss of principal. Past performance is not indicative of future results.
Copyright: All original content, including text and images, is the property of the author and may not be copied, reproduced, or published, in whole or in part, without prior written consent, except as permitted by applicable law or the terms of the platform on which it is published. Use of this content for training machine learning or AI models is not permitted without explicit authorization. Third-party or public domain images remain subject to their respective rights and are not claimed as the author’s property.