Monte Carlo Simulation Of Elicio's Phase II AMPLIFY-7P Study Favors Vaccine Efficacy
The readout of AMPLIFY-7P for ELI-002 7P in pancreatic cancer was expected by late 2025. Fewer events than projected pushed it to H1 2026. Monte Carlo simulation maps this delay onto control-arm survival and hazard ratio, with efficacy scenarios fitting 2–3× better.

Disclosure: The author holds a beneficial long position in Elicio Therapeutics, Inc. (NASDAQ: ELTX). This article is provided for informational and educational purposes only and is not financial advice. The Monte Carlo simulation presented here is a speculative modeling exercise built on estimated trial design parameters, literature-derived survival benchmarks, and assumptions about events that are not publicly disclosed. It cannot predict the outcome of the AMPLIFY-7P trial or any other clinical study. Although the author is a Medical Doctor, this content represents a personal analytical perspective and does not constitute medical advice, a diagnosis, or a treatment recommendation. The author receives no compensation for this article and has no business relationship with the company. Please see the full "Legal Information and Disclosures" section below.
In my article "Elicio's Therapeutic Vaccine for Pancreatic Cancer: A Revolution Hidden in Plain Sight?", I introduced Elicio Therapeutics (NASDAQ: ELTX) and the company's therapeutic cancer vaccine ELI-002. Since the readout of the Phase 2 AMPLIFY-7P study is still delayed, the clinical evidence for ELI-002 rests on the AMPLIFY-201 trial, which targeted two KRAS mutations (G12D and G12R) in patients with minimal residual disease (MRD) after surgery and chemotherapy for colorectal or pancreatic cancer (PDAC). Among the PDAC subset, median relapse-free survival (RFS) reached 15.31 months.
The Phase 1 study may be small and uncontrolled, but that is a striking result in an MRD-positive cohort: historical controls of strictly ctDNA-defined MRD-positive PDAC show medians of roughly 5 months (Groot et al., 2019) and 6.4 months (Botta et al., 2024). It should be noted, however, that AMPLIFY-201 defined MRD+ as positive ctDNA or elevated tumor markers (CA 19-9 or CEA), not ctDNA alone.
Phase 1 oncology signals, especially in PDAC, have a dismal track record in randomized settings, and the confidence interval around a median from 20 patients is wide enough that the true efficacy could land anywhere from encouraging to clinically meaningless. Still, 15 months RFS against a 5-to-6-month benchmark is hard to ignore, and that result motivated the randomized Phase 2 trial. Because AMPLIFY-7P is an adjuvant study, the primary endpoint is event-triggered, and the readout remains delayed. In what follows, I want to discuss whether this delay may be signal or noise.
The Phase 2 AMPLIFY-7P trial randomized 144 patients with resected KRAS-mutant PDAC 2:1 to ELI-002 7P or observation between January 11 and December 3, 2024, with crossover at confirmed relapse. The primary endpoint is disease-free survival (DFS) under a group sequential design (GSD) controlling overall alpha at 0.10. A GSD allows a trial to stop early at preplanned interim analyses, either for efficacy (if the treatment effect is already strong enough) or futility (if the data suggest the drug is unlikely to work), while controlling the overall false-positive rate; the cost is a slightly higher event target at the final analysis to compensate for the repeated looks at the data. Enrollment is MRD-agnostic: patients qualify regardless of ctDNA status, provided they show no evidence of disease (NED) on imaging and have recovered lymphocyte counts. The 7P formulation targets seven KRAS mutations (G12D, G12R, G12V, G12C, G12A, G12S and G13D) instead of two, broadening the eligible population but introducing untested biology.
Elicio expected results by late 2025. On August 5, 2025, the company announced that the independent data monitoring committee (IDMC) recommended continuation without modifications. Elicio's reading of this recommendation was that "ELI-002 7P has shown preliminary signals of efficacy." This characterization may be the company's, not the IDMC's own language. Then on November 13, 2025, Elicio disclosed that as of November 6, fewer progressions and deaths than projected had been observed. The readout was pushed to H1 2026, with the company noting that the shortfall "may reflect a favorable impact on disease-free survival" given the 2:1 randomization favoring the treatment arm.
The optimistic reading is that the vaccine is working: fewer events in the treatment arm stretch the calendar toward the event target. But a simpler explanation requires no treatment effect. The control arm may just be living longer than the design assumed. If so, events accumulate more slowly regardless of what the vaccine does. The most plausible reason is the shift toward neoadjuvant chemotherapy. Patients enrolled in 2024 likely received neoadjuvant FOLFIRINOX before surgery, while the trial's powering assumptions may have been informed by older adjuvant-era data.
The MRD-agnostic, NED-required enrollment selects for favorable biology: patients who responded to chemotherapy, tolerated surgery, and showed no radiological residual disease. What sets them apart from historical comparators is the intensity of pre-surgical treatment. In 2024, 4 to 10 cycles of neoadjuvant FOLFIRINOX were standard for most cases, often followed by adjuvant cycles. Patients who survive that sequence and arrive at vaccination with NED status are a selected group whose DFS from vaccination should be longer than older benchmarks suggest. When background survival improves faster than the trial design anticipated, an event-driven study simply takes longer. In that case, no vaccine effect is necessary to explain the delay. Fortunately, we can estimate DFS in a cohort treated with the current standard of care and use Monte Carlo simulation to evaluate what this delay might imply.
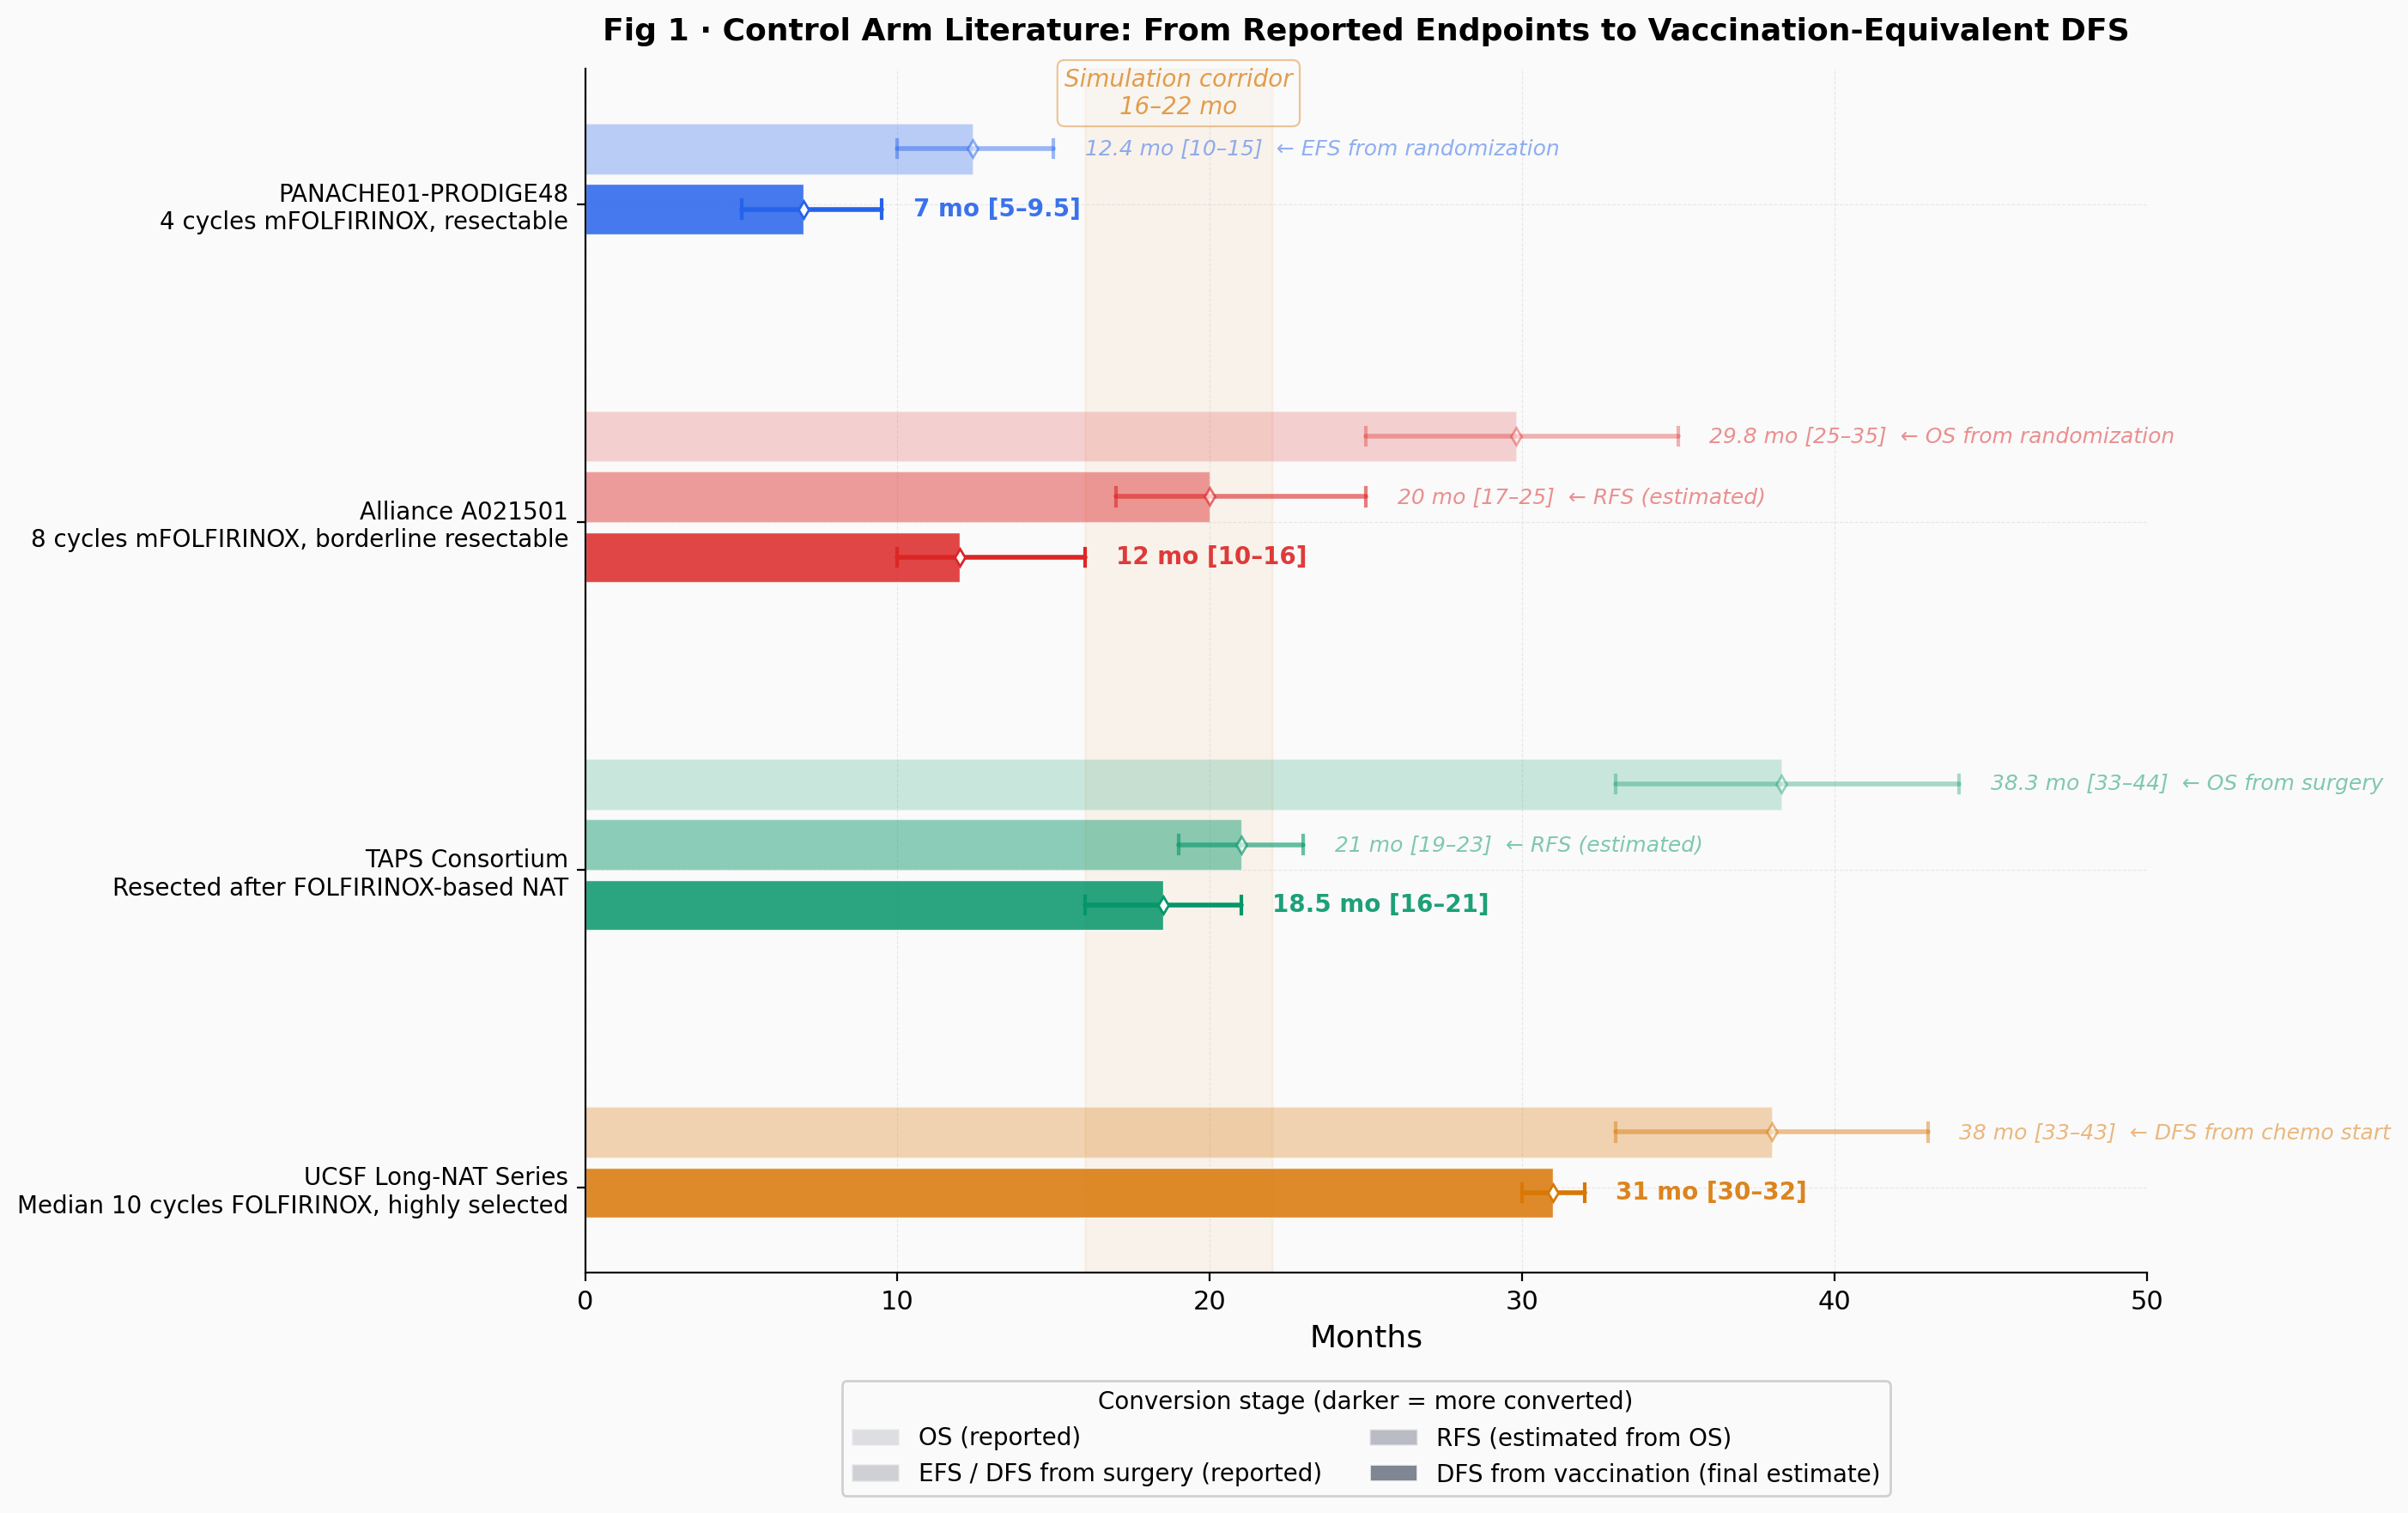
No published study measures exactly what AMPLIFY-7P's control arm measures: DFS from vaccination in NED patients after neoadjuvant therapy and surgery. Every estimate requires converting published endpoints into a vaccination-equivalent time zero, and each conversion introduces uncertainty. Patients who survive long enough to be vaccinated are also enriched for favorable biology, pushing the plausible control median toward the upper end.
The PANACHE01-PRODIGE48 trial (Schwarz et al., JCO 2025) randomized resectable patients to 4 cycles of neoadjuvant mFOLFIRINOX versus upfront surgery. The neoadjuvant arm achieved median event-free survival of 12.4 months from randomization. After subtracting 5 to 6 months of lead time, that translates to roughly 7 months from vaccination, the shortest estimate and reflecting limited neoadjuvant exposure. The Alliance A021501 trial (Katz et al., JAMA Oncol 2022) tested 8 cycles of neoadjuvant mFOLFIRINOX in borderline resectable patients, with median OS of 29.8 months, giving roughly 10 to 16 months from vaccination after conversion and lead time subtraction. The TAPS Consortium (Janssen et al., JNCI 2022) pooled resected patients across multiple centers, reporting median OS of 38.3 months from surgery and yielding roughly 16 to 21 months from vaccination, probably the most relevant comparator. The UCSF long-NAT series (Miller et al., Ann Surg Oncol 2024) reports median DFS of 38 months in patients who received FOLFIRINOX (median 10 cycles) before surgery, giving roughly 30 to 32 months from vaccination at the upper extreme.
The central corridor is 16 to 22 months, bracketed by PANACHE01 at the lower extreme and UCSF at the upper.
To explore how the readout delay maps onto combinations of control median and hazard ratio, the following analysis uses a Monte Carlo simulation. For each of ten predefined scenarios, it generates 10,000 synthetic trial trajectories. For the full parameter-space heatmap, it runs 3,000 trajectories per cell. Sensitivity sweeps use 2,000 to 4,000 trajectories per configuration, yielding wider confidence bands on those estimates. Each trajectory simulates individual patient enrollment dates (drawn from a probability distribution over the enrollment window), DFS events from a Weibull survival model, dropout, interim monitoring, and a formal log-rank test at the final analysis. The log-rank test is the standard nonparametric method for comparing two survival curves; it assigns a Z-statistic that measures how far the observed difference between arms deviates from what would be expected under no treatment effect. Trajectories that are inconsistent with publicly known constraints are discarded, and what remains is compared across scenarios. This is speculative modeling. The event target, the IDMC's exact data, and the control arm's actual survival distribution are all unknown. No Monte Carlo simulation, however many trajectories it generates, can predict the outcome of a real-world clinical trial. Readers should treat the results as a mapping exercise: given these assumptions, which scenarios produce timelines consistent with what we have observed?
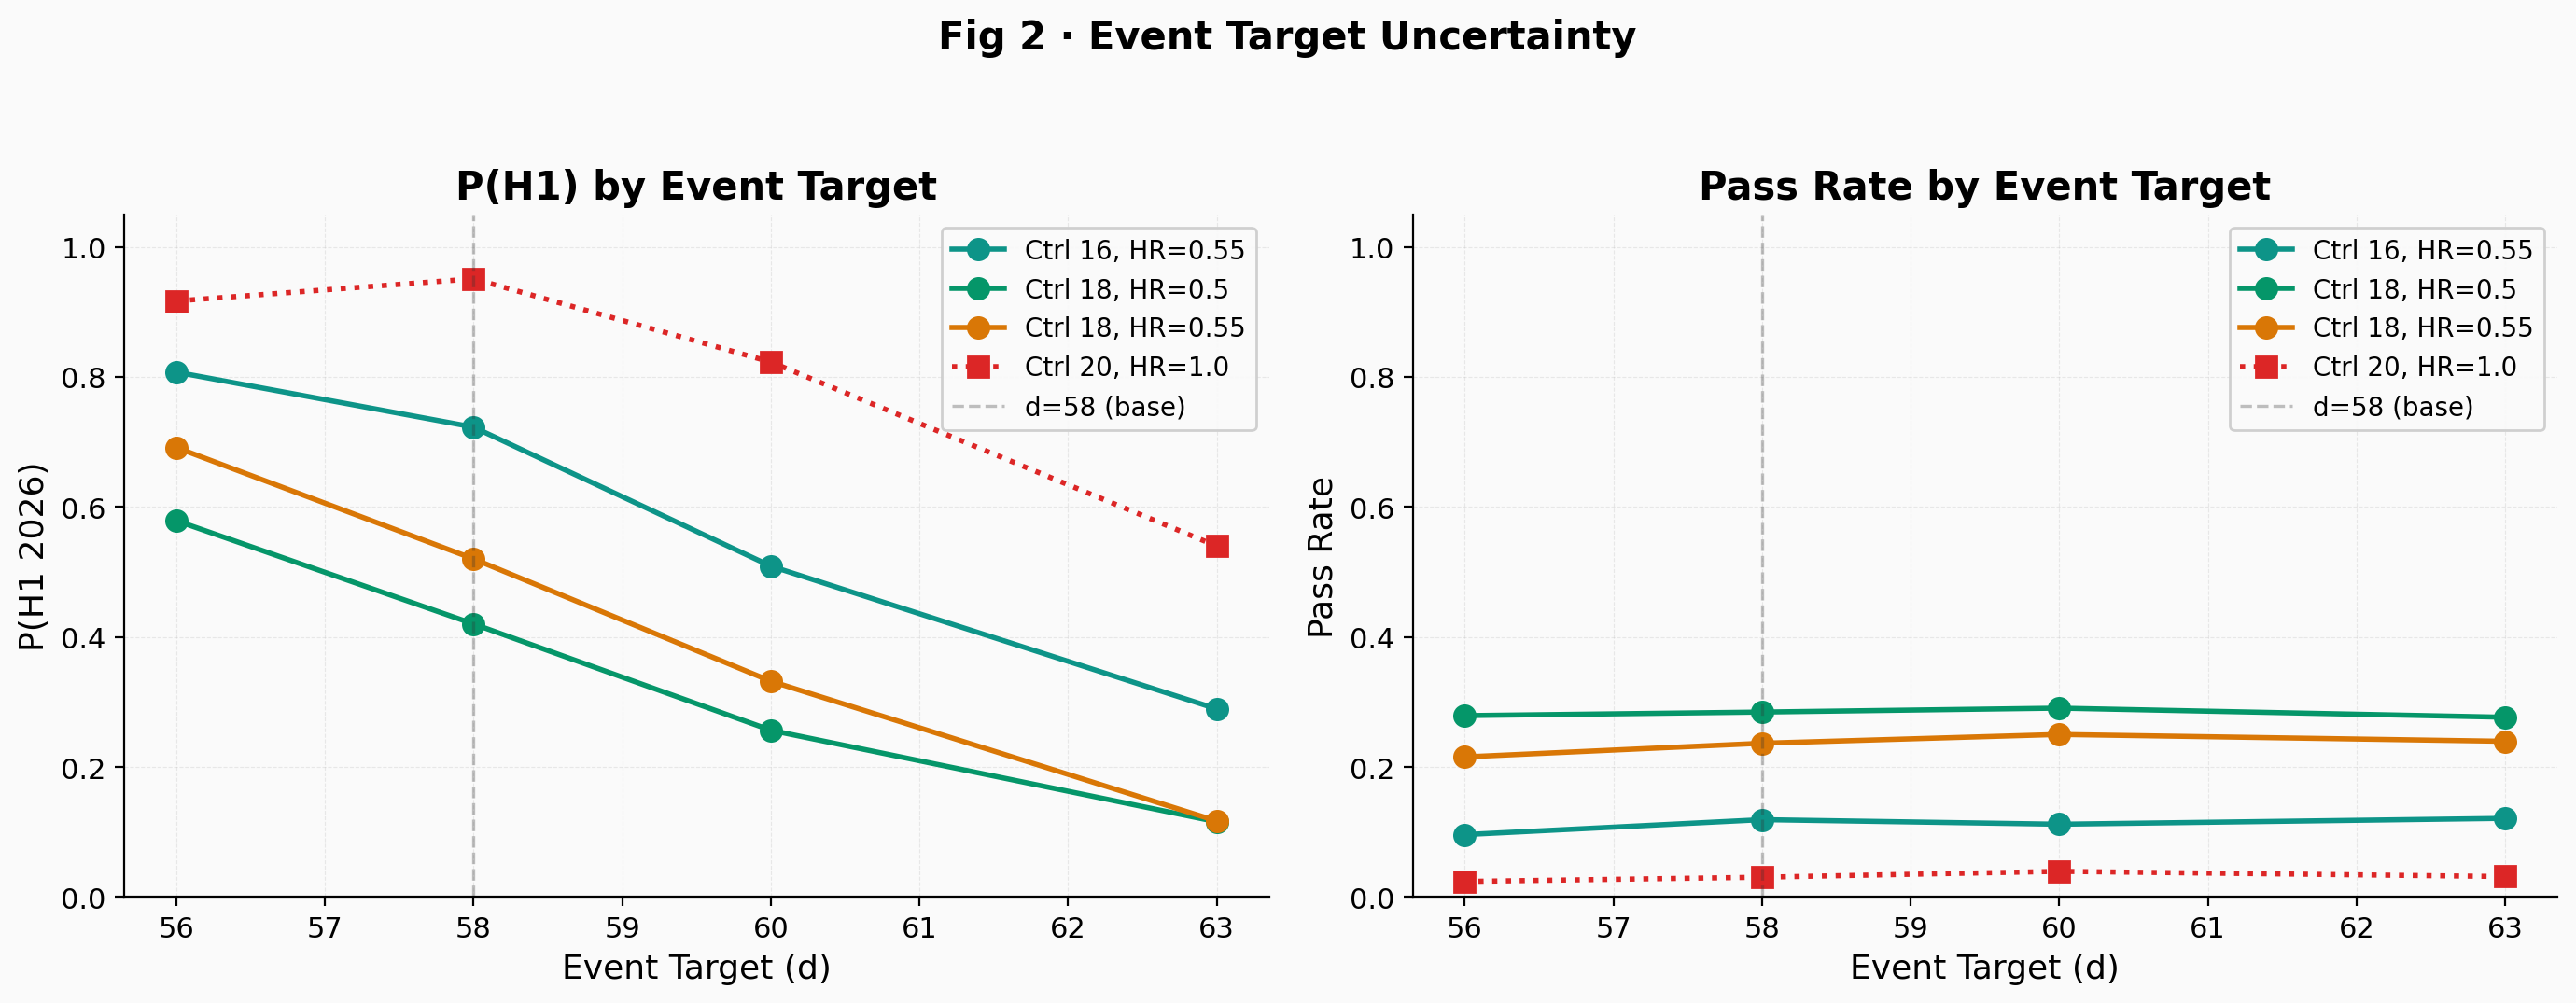
The Schoenfeld formula with overall alpha = 0.10, 80% power, 2:1 allocation, and an estimated target HR = 0.55 gives approximately 57 events before group sequential inflation. The Schoenfeld formula relates the number of events required to detect a given hazard ratio to the allocation ratio, the significance level, and the desired power; it is the standard tool for sizing event-driven trials. This assumes proportional hazards; the immune-delay model violates this assumption during the first 3 months, which the simulation accounts for but the Schoenfeld formula does not. The O'Brien-Fleming adjustment at one interim look (50% information fraction) yields a target of d = 58 using an inflation factor of approximately 1.027. The protocol target is unknown, so the simulation tests d = 56, 58, 60, and 63 in sensitivity (Fig 2). Under the tested scenarios, each additional event costs roughly 4 to 8 weeks, making the assumed event target one of the most impactful parameters.
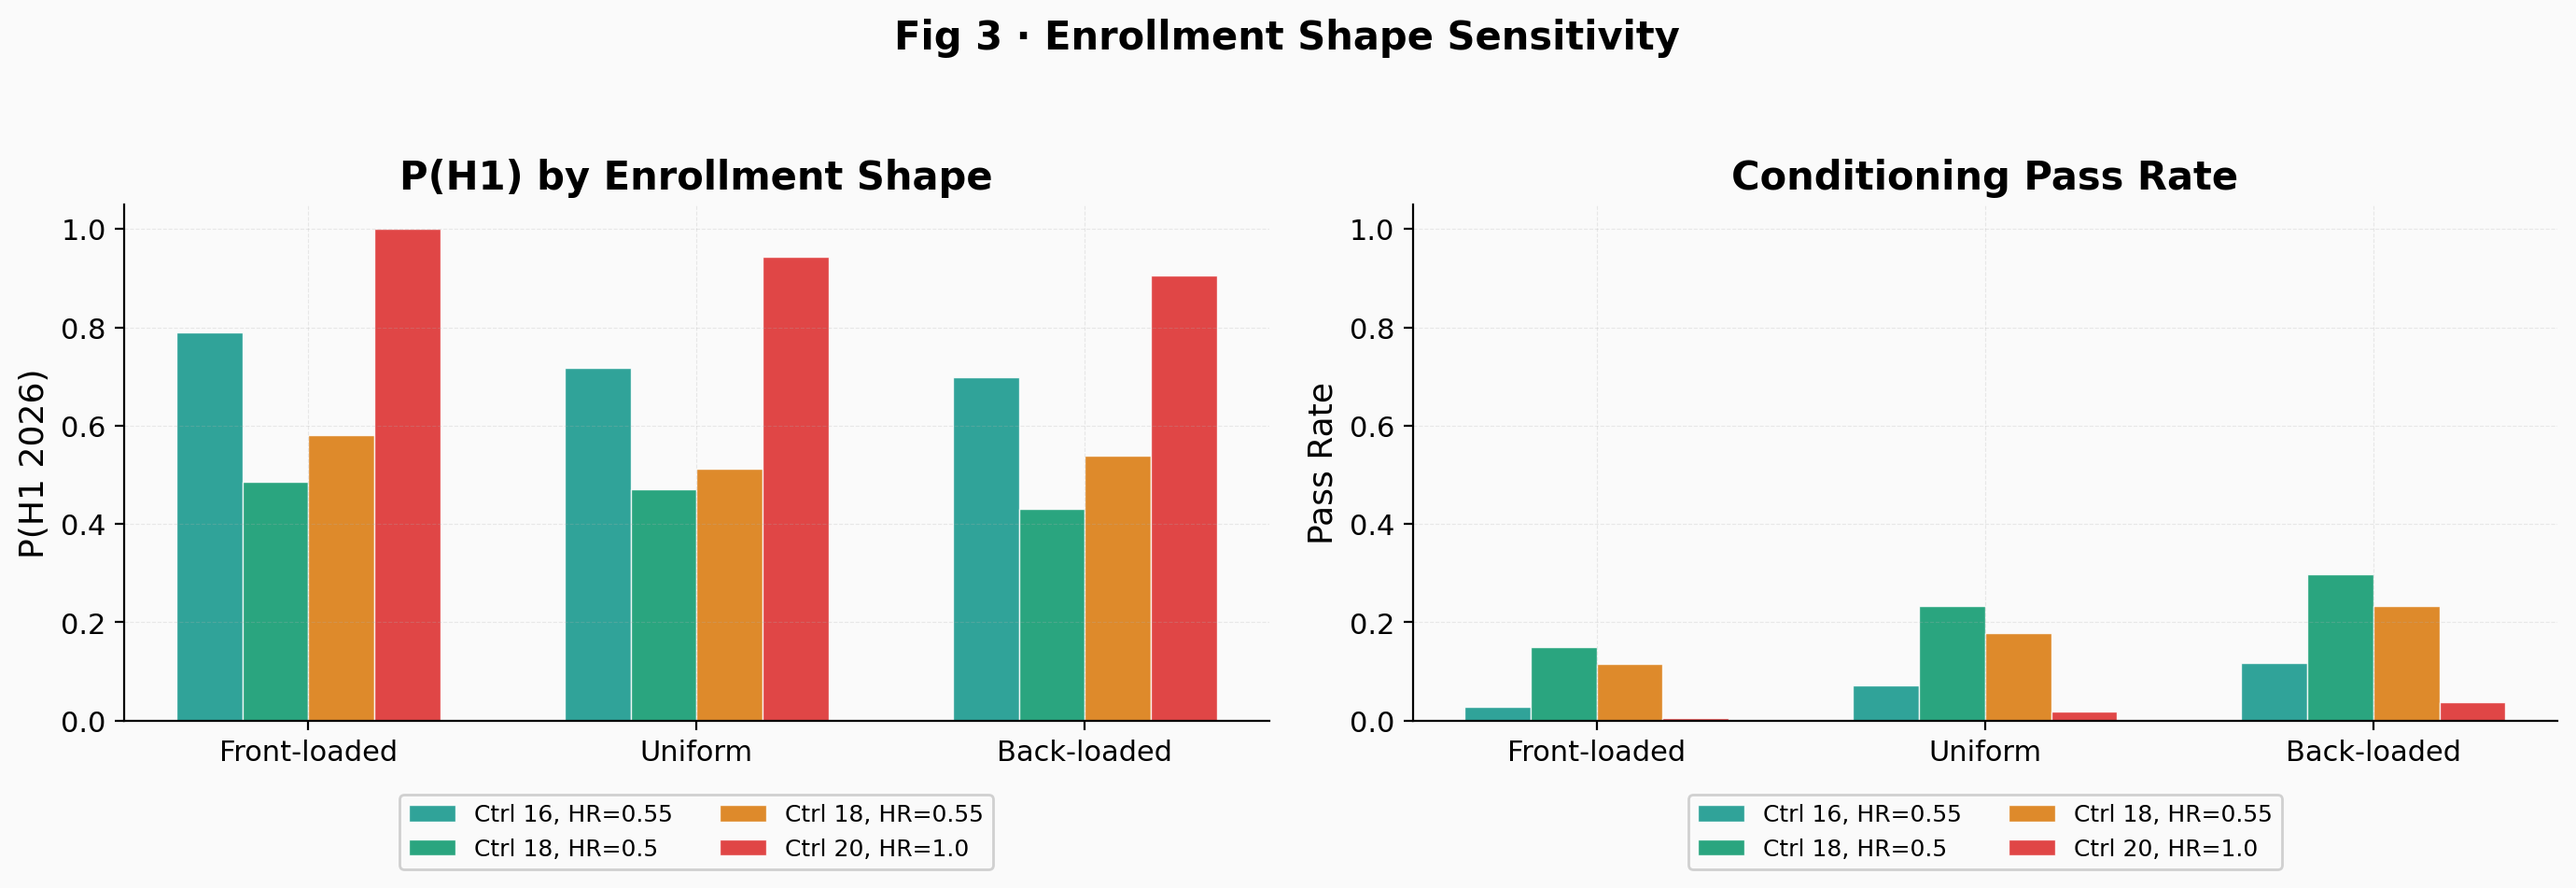
The control arm follows a Weibull distribution with shape k = 0.85 (decreasing hazard, tested from 0.80 to 1.0). A Weibull shape below 1.0 means the hazard of recurrence decreases over time, consistent with the clinical intuition that patients who survive the first year without relapse become progressively less likely to recur. The treatment arm uses a piecewise hazard: HR = 1.0 during the first 3 months of immune priming, then the target HR kicks in as a step function. This models the fact that a cancer vaccine does not work from day one; the immune system needs time to mount KRAS-specific T-cell responses. Enrollment follows a Beta(2.0, 1.3) distribution, back-loaded to reflect the post-surgery recovery pipeline. In an adjuvant trial requiring KRAS mutation testing, NED status, and recovered lymphocyte counts, patient flow depends on the time it takes to complete chemotherapy, surgery, and recovery. The shape of the enrollment distribution turns out to be surprisingly consequential: front-loaded enrollment sharply reduces the null's conditioning pass rate because earlier patients contribute longer follow-up and generate more events by any fixed calendar date (Fig 3).
Every simulated trajectory must satisfy five conditioning constraints to be retained. It needs at least 29 events by the estimated IDMC data cut (June 1, 2025) and fewer than an assumed cap of 50 events by the effective data date underlying the November 6 disclosure (approximately four weeks earlier, accounting for site reporting lag), reflecting the "fewer than projected" disclosure. The trial must eventually reach its event target. The d-th event must not have occurred before approximately January 11, 2026, which, given an assumed 7-week operational lag between data cutoff and public announcement, means the announcement has not yet occurred as of March 1, 2026. And the interim log-rank Z must fall between 0.25 and 1.81, meaning the trial was neither stopped for futility nor for early efficacy at the O'Brien-Fleming boundary. The lower bound of 0.25 is what makes Elicio's characterization of the IDMC recommendation matter quantitatively. Under the null, P(Z > 0.25) is about 40%, so this constraint eliminates a meaningful fraction of null trajectories. Under HR = 0.55, the simulation estimates P(Z_IA > 0.25) at approximately 88% to 94% at the interim analysis, depending on the control median. The simulation sweeps this threshold from 0.0 to 0.84 to test how different readings of "preliminary signals of efficacy" affect the results. Additional sensitivity sweeps cover the November cap (45 to 60), Weibull shape, immune delay (2 to 5 months), dropout (symmetric and differential), and joint interactions. The Weibull shape and immune delay interact: when k < 1, events concentrate earlier, amplifying the power dilution from immune delay. Dropout has bounded effects of 2 to 5 percentage points even under differential configurations.
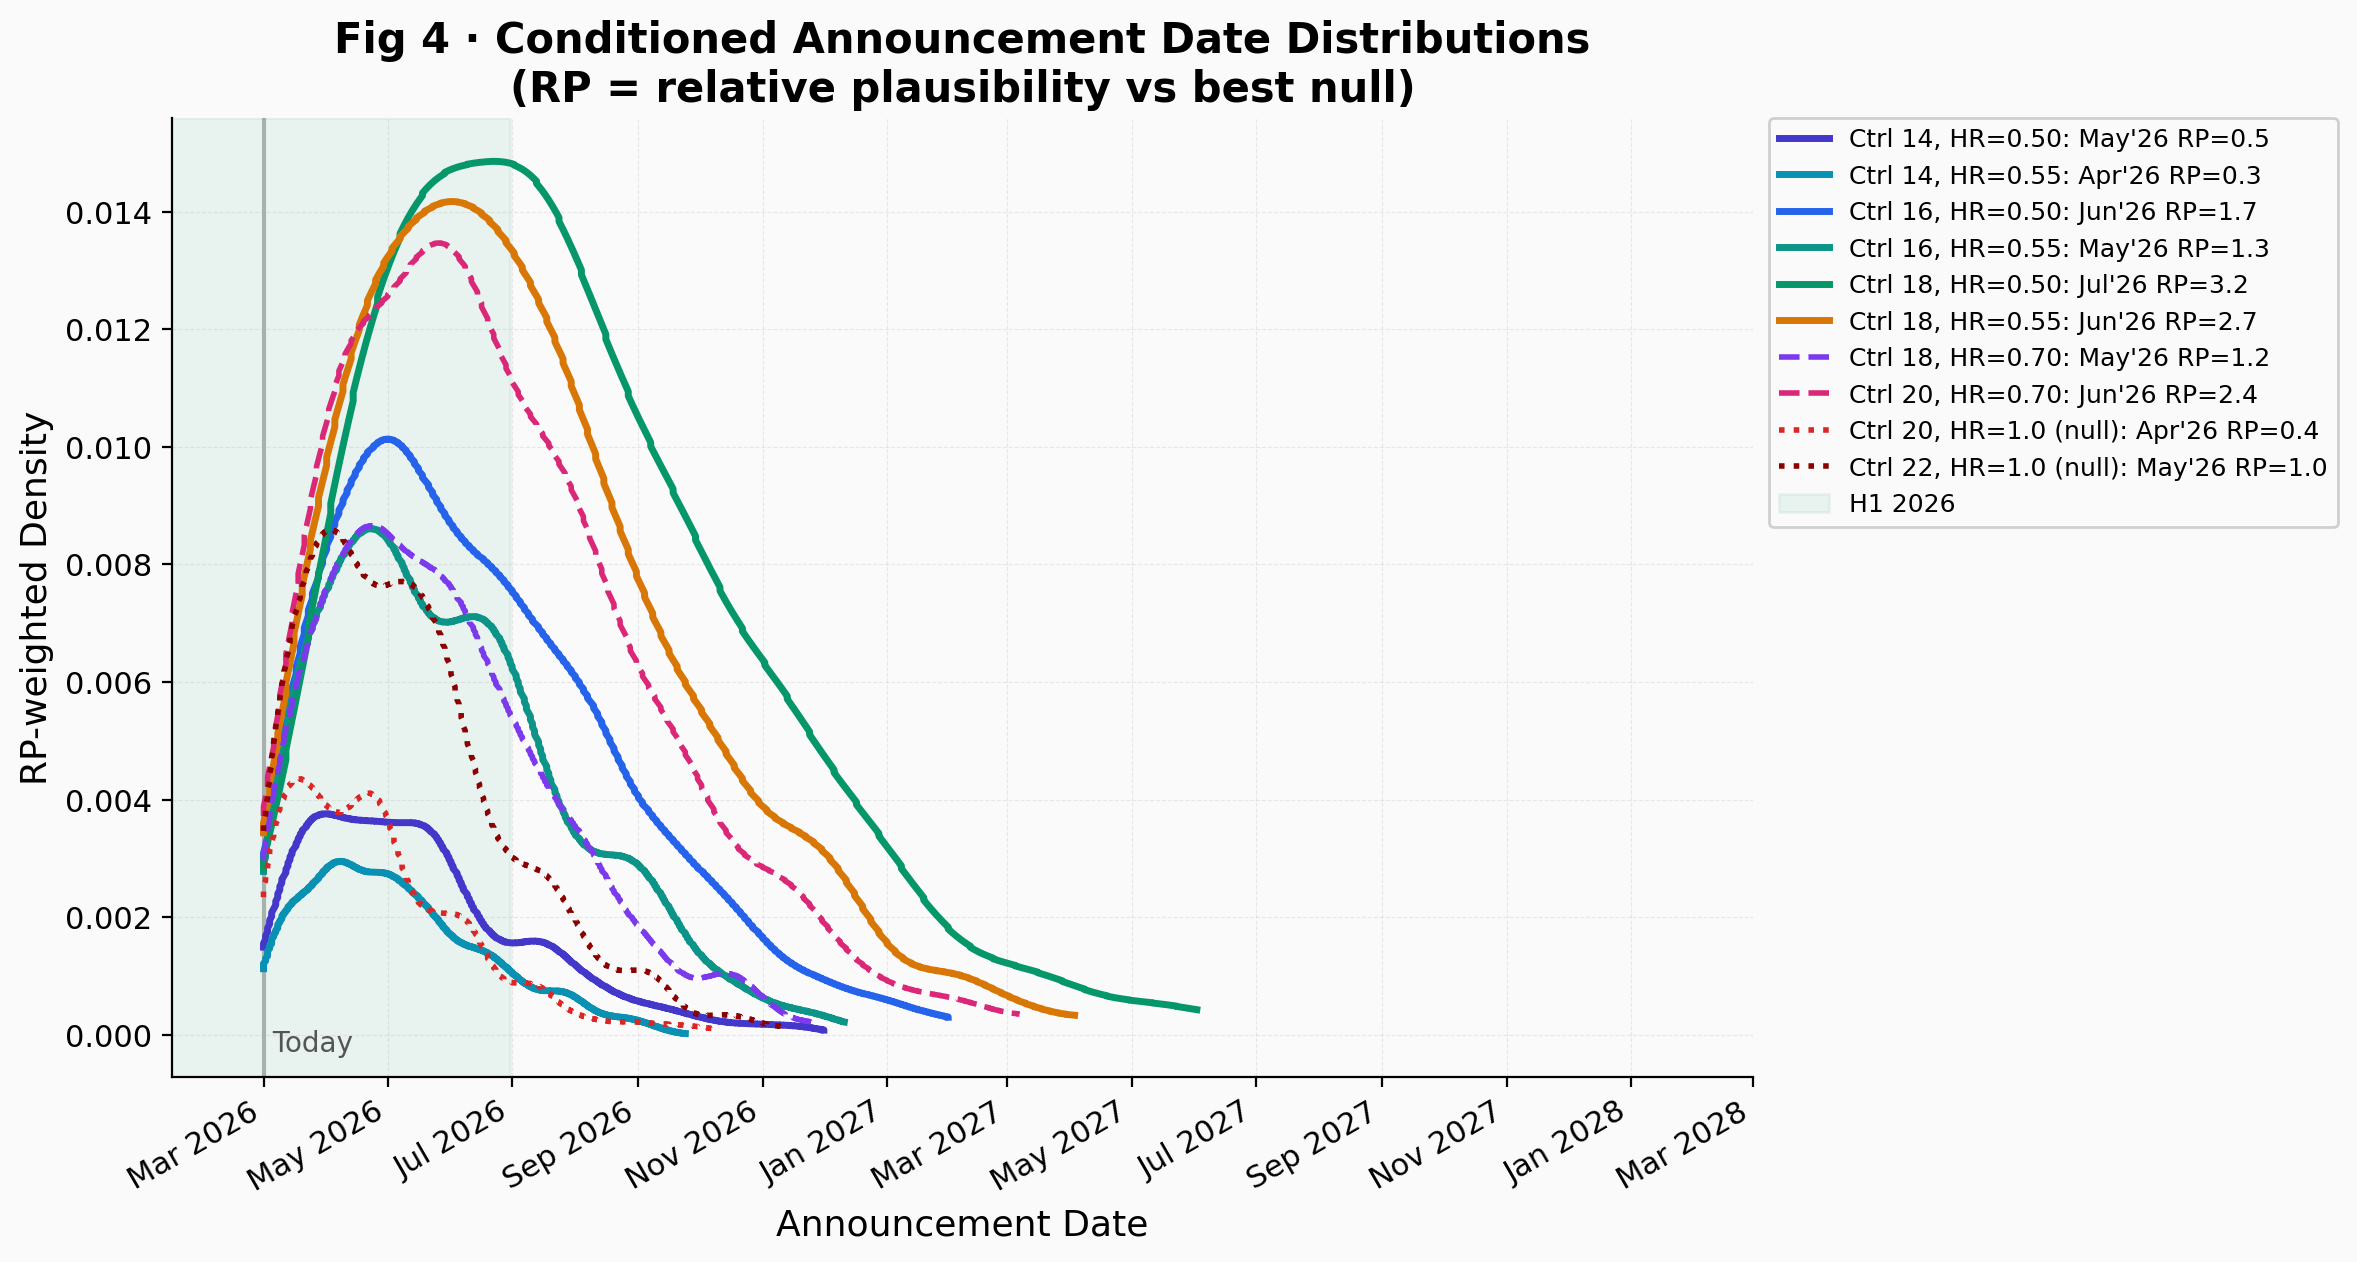
The ratio of a scenario's conditioning pass rate to the best null's pass rate is called "relative plausibility" (RP). This is not a likelihood ratio. The conditioning constraints are not sufficient statistics for (HR, control median), so RP has no calibrated interpretation on any evidence scale. An RP of 2.5 means only that the efficacy scenario generates trajectories matching the observed constraints more often than the best null. It is useful for ordering, nothing more.
Because RP depends on Monte Carlo sampling, all values are approximate and vary across simulation runs with different random seeds and trajectory counts. The values below are from the 10,000-trajectory main run; the heatmap in Fig 7 uses a separate 3,000-trajectory-per-cell run and will show slightly different values for the same cells.
The highest RP belongs to Ctrl 18 / HR = 0.50 at approximately 3.2. Ctrl 18 / HR = 0.55 reaches about 2.7 and Ctrl 20 / HR = 0.70 about 2.4. Shorter control medians like Ctrl 16 / HR = 0.55 produce lower RP (about 1.3), consistent with a readout timeline that has mostly elapsed. The delay favors longer control arms: shorter medians like 16 months remain consistent with the observations but are less probable than medians of 18 to 20 months. If the control median were 14 months, most of the 10,000 simulated trajectories would have reached the event target well before November 2025 regardless of whether the vaccine works. Slow event accumulation points toward a control median in the 16 to 20 month range, exactly where the neoadjuvant literature suggests it should be. The conditioned announcement date distributions (Fig 4) visualize these differences.
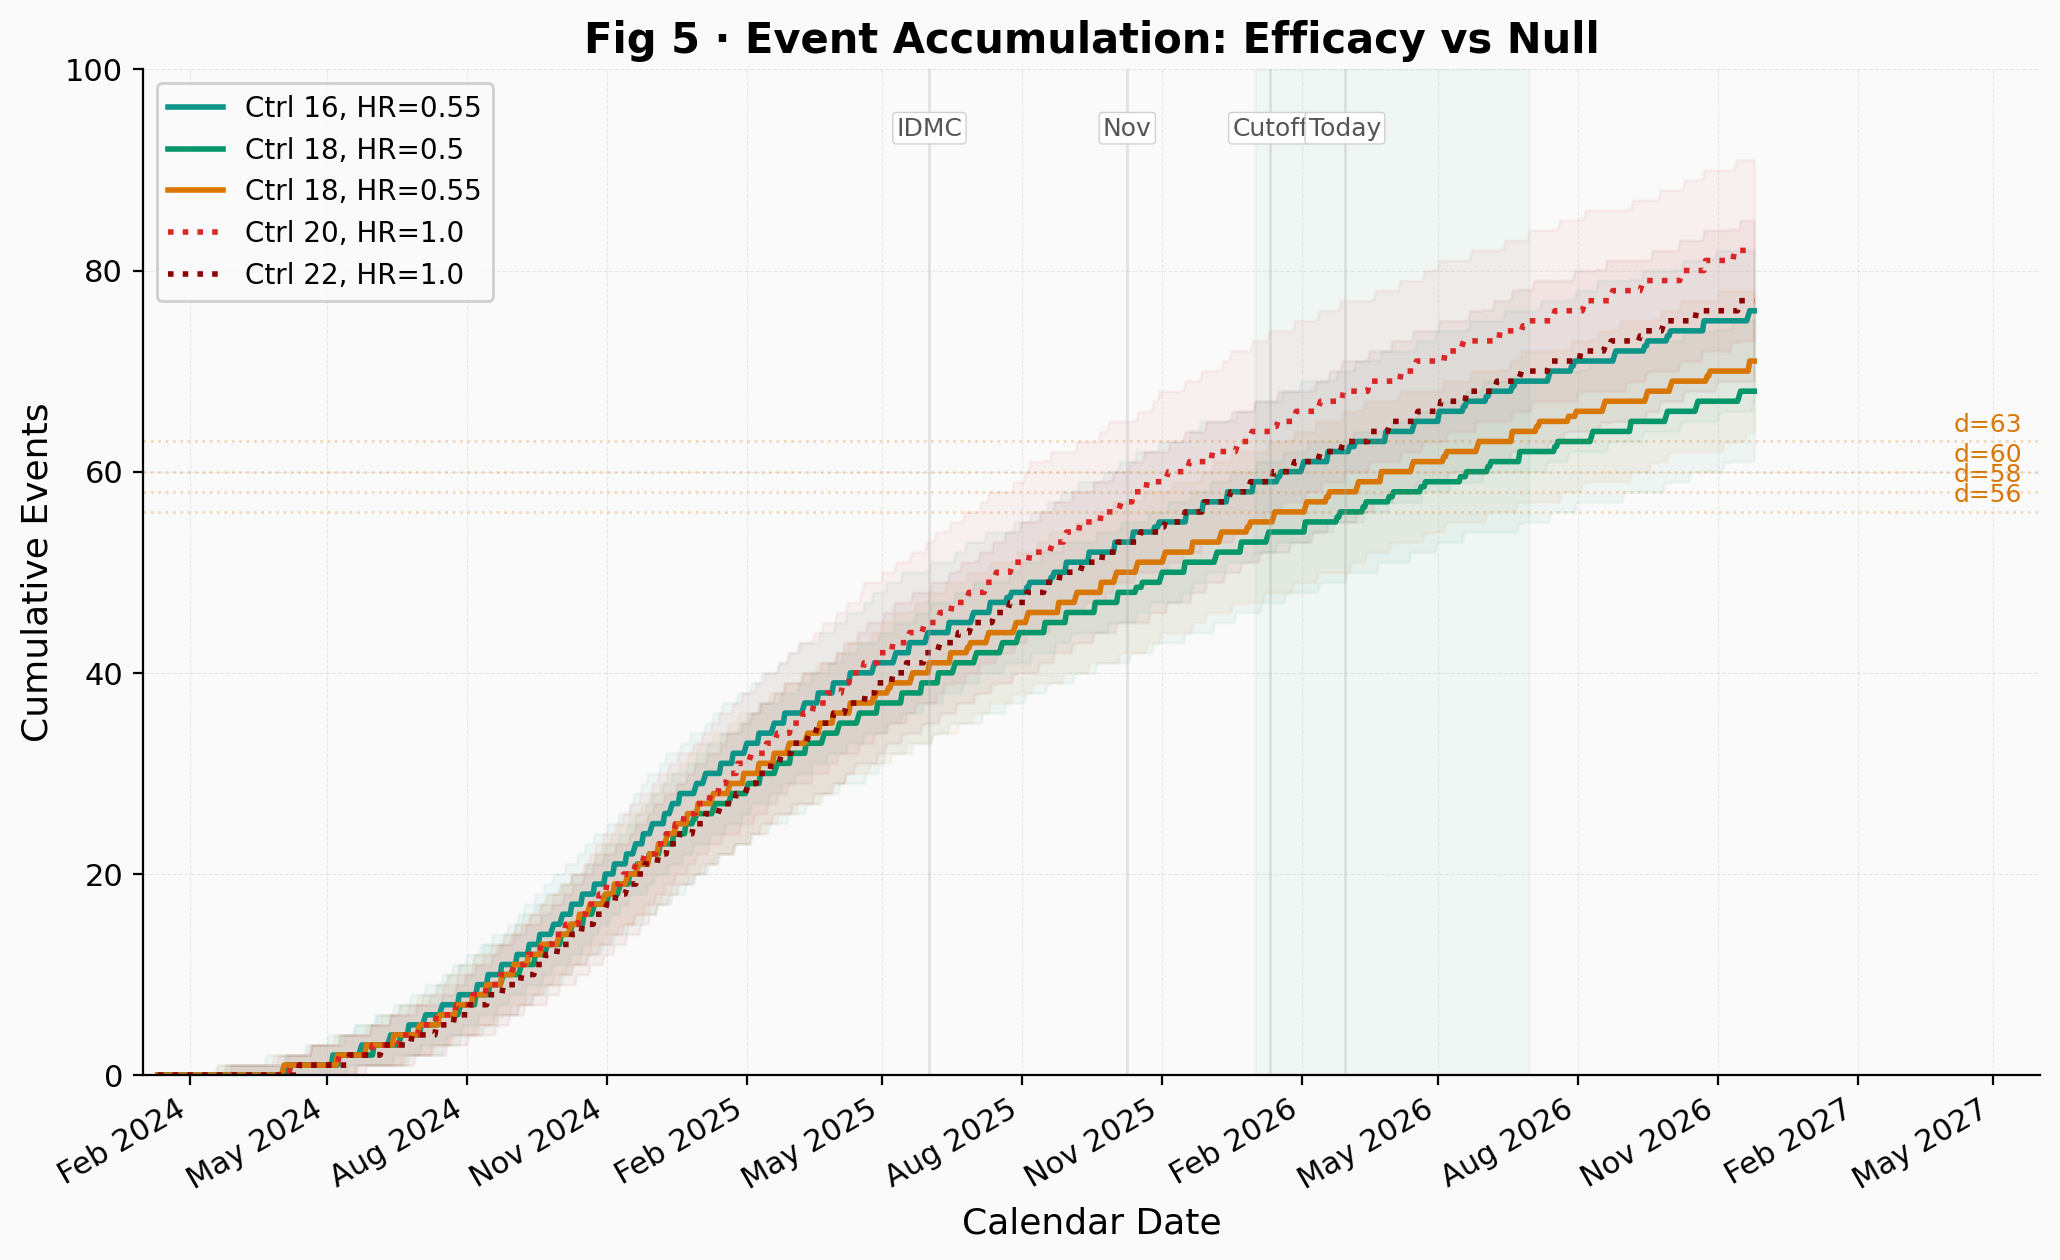
One of the most telling outputs of the simulation is the event accumulation plot (Fig 5). Under efficacy with Ctrl 18 / HR = 0.55 and under the null with Ctrl 22 / HR = 1.0, the median event trajectories reach d = 58 in approximately the same calendar window. From outside the trial, looking only at aggregate event pace, these two very different scenarios are indistinguishable.
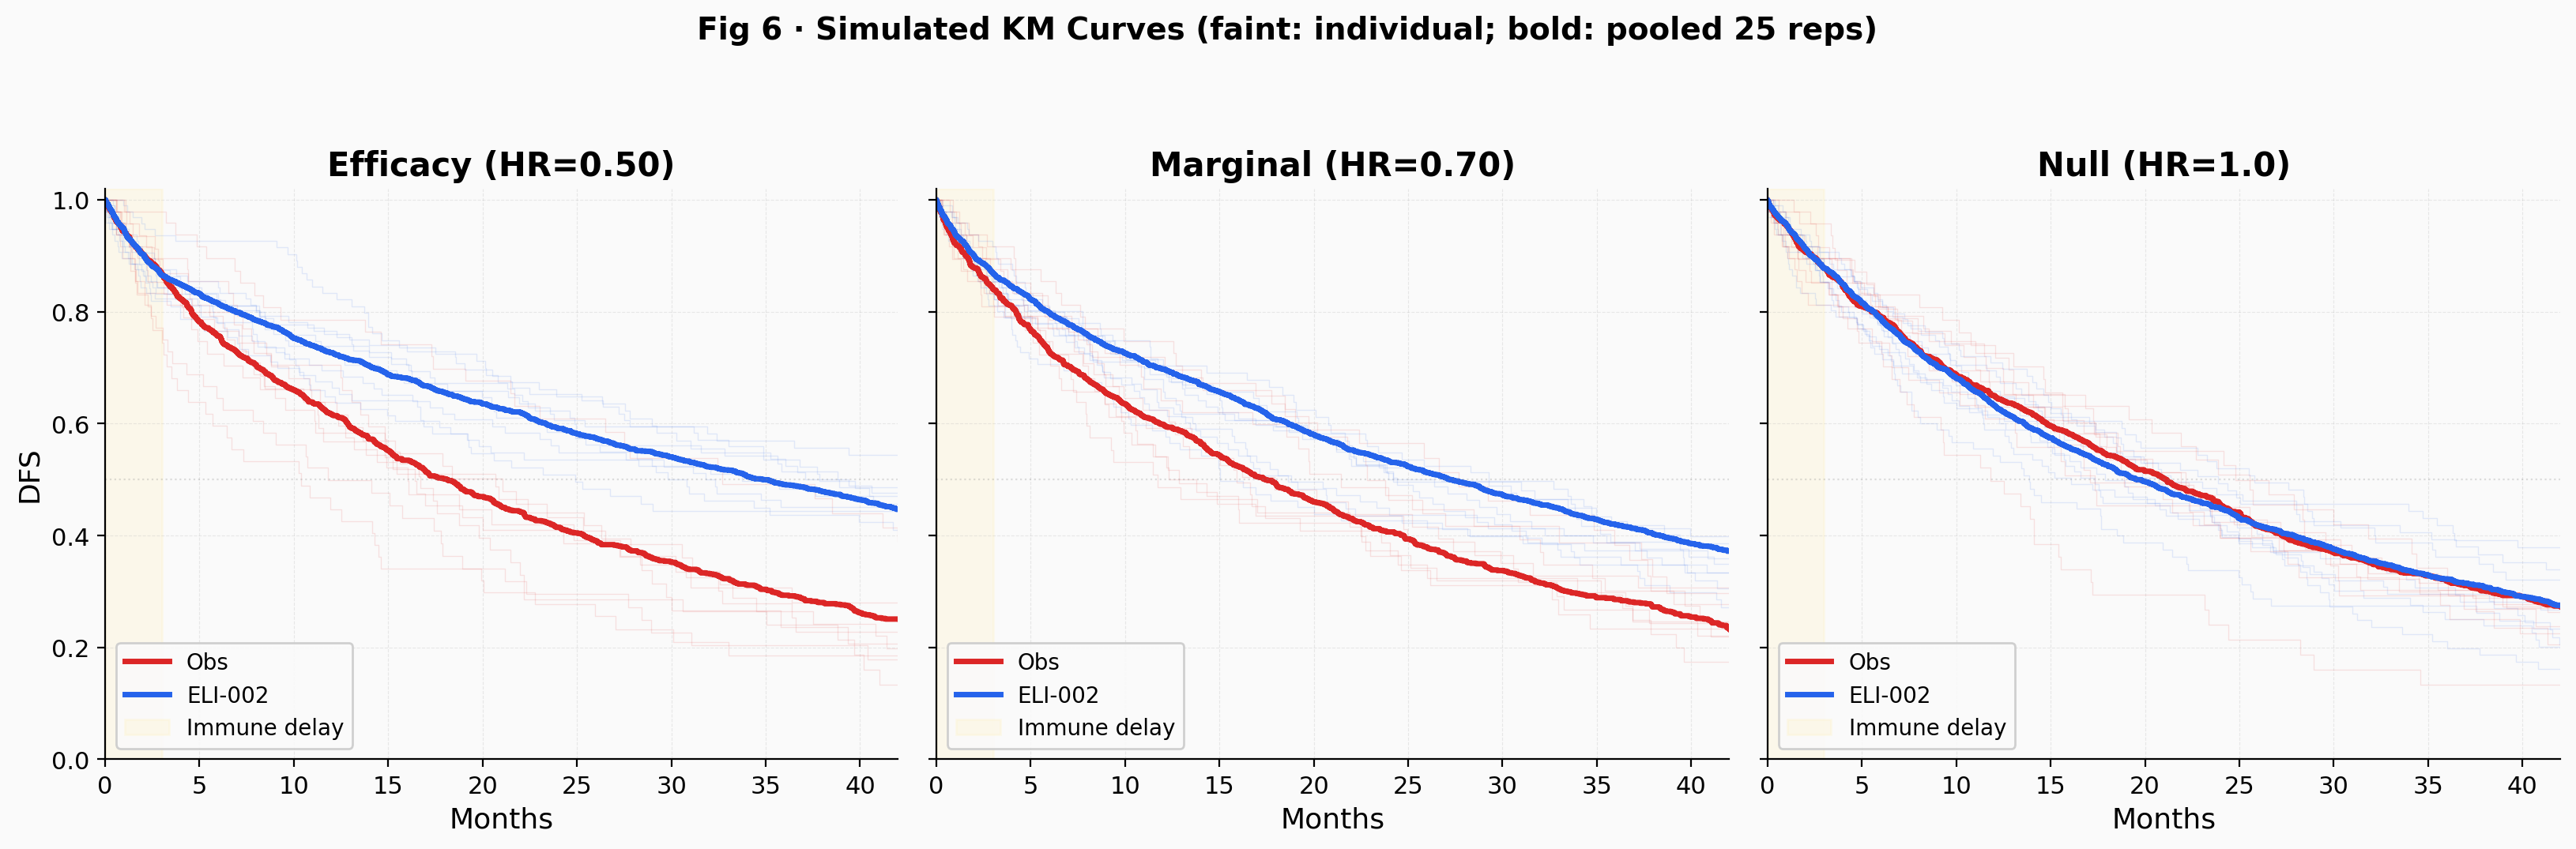
What separates them is the arm-level survival that the IDMC reviewed in the unblinded data. The simulated Kaplan-Meier curves in Fig 6 show both individual trial replications (faint) and pooled averages (bold) to convey the trial-level variability at N = 144. Under HR = 1.0, there would be no visible separation between arms and thus no basis for Elicio's characterization of the recommendation as reflecting efficacy. Under HR = 0.50, the curves separate visibly but the noise at 50% information is substantial. Under HR = 0.70, the picture is ambiguous. This arm-level view is the strongest evidence against the null, and it sits entirely outside the simulation's reach. The counterargument: IDMCs sometimes recommend continuation simply because the data are not futile, and the company's interpretive gloss may overstate what the committee actually concluded. Random variation at an interim look can also produce apparent separation that does not hold at the final analysis.
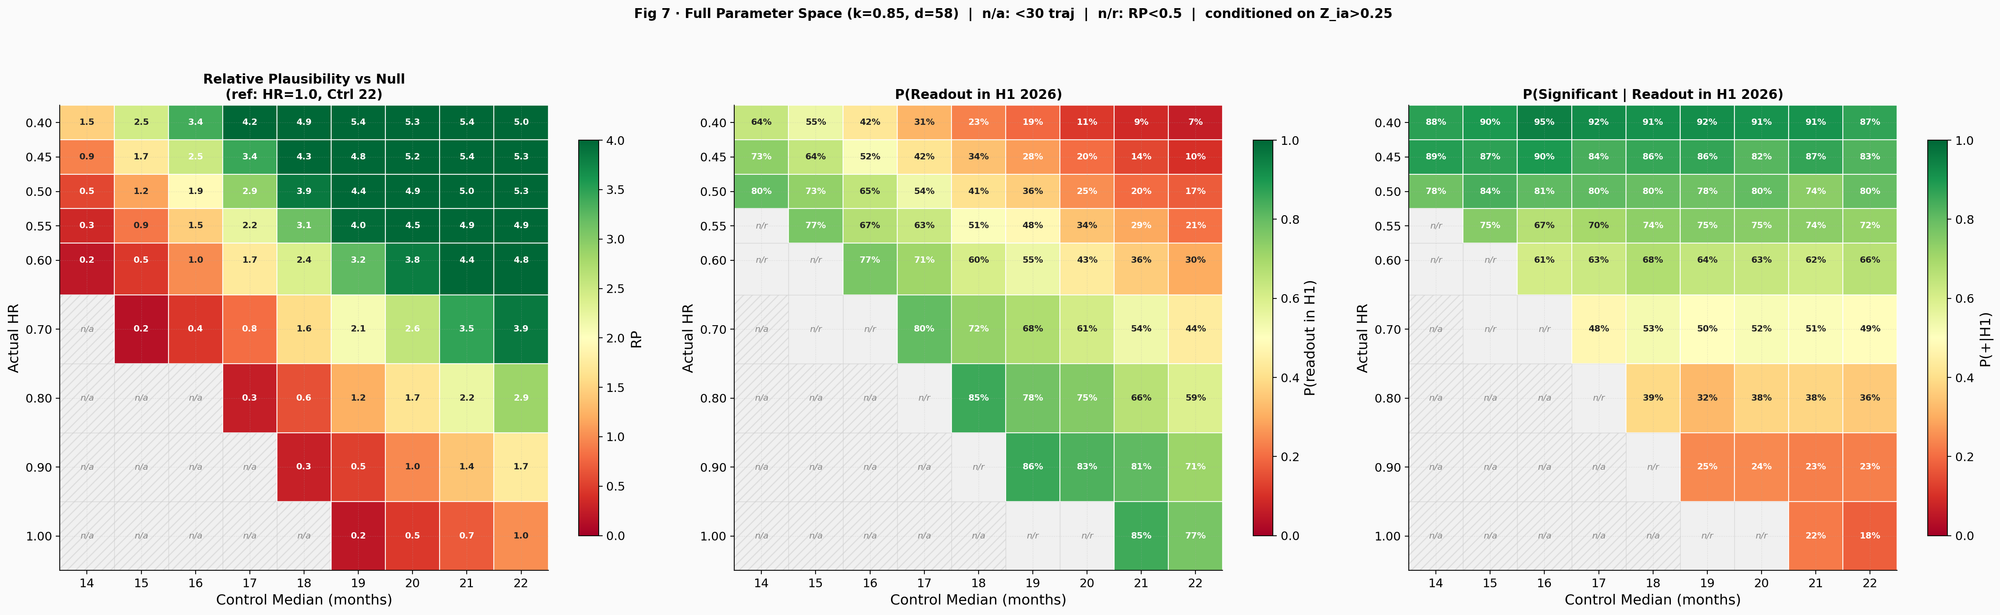
The three-panel heatmap (Fig 7) maps the full parameter space across 3,000 Monte Carlo trajectories per cell. The left panel shows RP, peaking at approximately 3.9 to 5.4 for control medians of 18 to 20 months with HR 0.40 to 0.50. The center panel shows P(H1 2026 readout), increasing toward higher HR because a weaker effect means faster events. The right panel shows P(positive H1 2026 readout), computed by running the log-rank test on each conditioned trajectory and checking whether Z exceeds the calibrated final boundary (Z = 1.31, numerically calibrated to control the overall type I error at exactly 0.10 after accounting for the interim look). Under favorable assumptions (HR = 0.50, control 18 to 20 months), P(positive H1) reaches approximately 80%. Under marginal efficacy (HR = 0.70), it drops to roughly 50%. Cells with fewer than 30 conditioned trajectories are masked as "n/a"; cells where RP < 0.5 are masked as "n/r" to focus attention on the plausible region.
A March or April 2026 readout fits two different stories: strong efficacy (HR 0.40 to 0.50) with a shorter control median (16 to 18 months), or no effect with a long control arm (20 to 22 months). The calendars overlap, but RP separates them: roughly 2 to 5 for efficacy scenarios, near 1 for the null. A May or June readout is the most probable window for moderate efficacy (HR 0.55 to 0.65) with a control median of 18 to 20 months. Under those conditions, the probability of crossing the significance boundary is about 63% to 75%, depending on the exact HR and control median, though the immune delay still dilutes power relative to what a standard drug would achieve with the same HR. If the readout slides into H2 2026, it becomes progressively less consistent with the null with any control median of 14 to 22 months. That timing points to strong efficacy combined with a long control arm (the classic paradox where the drug delays its own readout) or a control arm exceeding the existing literature.
The simulation's P(H1 2026) may understate the actual probability of an H1 readout because it conditions only on public information through November 2025. The company, which has access to the current event count, guided H1 2026 with what is presumably a more informed projection. If the event target is at the lower end of the tested range (d = 56), or if the operational lag between data cutoff and announcement is shorter than the assumed 7 weeks, P(H1) increases materially across all scenarios.
The readout delay is best explained by a control arm living longer than the design anticipated. The shift toward neoadjuvant FOLFIRINOX is the simplest driver, and the literature points to a vaccination-equivalent control DFS of 16 to 22 months, well above the adjuvant-era benchmarks that likely informed the trial's powering. Within that range, HRs of 0.50 to 0.65 are most consistent with the observed timeline and Elicio's characterization of the IDMC recommendation, producing RP values of approximately 2.7 to 3.2 in the 10,000-trajectory main run (roughly 2.4 to 4.9 in the 3,000-trajectory heatmap of Fig 7) relative to the best null. But that is modest discrimination. The null paired with a long control arm of 20 to 22 months passes the same filters at only slightly lower rates.
To be clear: this is a Monte Carlo simulation of 10,000 synthetic trajectories per scenario, built on assumptions about trial design parameters that are not public. The model cannot access what the IDMC saw in the unblinded data. Its "relative plausibility" metric has no calibrated inferential meaning and should not be confused with a likelihood ratio or Bayes factor. No simulation can substitute for the randomized data that the trial will eventually report. Whatever the IDMC actually observed in the arm-level separation probably carries more evidentiary weight than the entire quantitative apparatus presented here. The results are a map of what is consistent with the observed data, not a prediction of what will happen.
Follow me on X for frequent updates (@chaotropy).
Legal Information and Disclosures
General Disclaimer & No Financial Advice: The content of this article is for informational and educational purposes only. It represents the personal opinions of the author as of the date of publication and may change without notice. The author is not a registered investment advisor or financial analyst. This content is not intended to be, and shall not be construed as, financial, legal, tax, or investment advice. It does not constitute a personal recommendation or an assessment of suitability for any specific investor. This article does not constitute an offer to sell, a solicitation of an offer to buy, or a recommendation of any security. Readers should conduct their own independent due diligence and consult with a certified financial professional before making any investment decisions. This article is not a securities research report and has not been prepared in accordance with legal requirements designed to promote the independence of investment research.
Medical Disclaimer: Although the author possesses a medical background, the information presented here regarding clinical trials, survival endpoints, or pharmaceutical mechanisms is strictly for the purpose of educational discussion and general commentary regarding the underlying science. It does not constitute medical advice, a diagnosis, or a treatment recommendation, nor does it establish a physician-patient relationship. Readers should never disregard professional medical advice or delay in seeking it because of something read on this website. Always consult a qualified healthcare provider regarding any medical condition.
Monte Carlo Simulation Disclaimer: The simulation presented in this article is a speculative modeling exercise. It relies on estimated trial design parameters (including the event target, interim analysis timing, and group sequential boundaries), literature-derived control arm survival benchmarks converted to a vaccination-equivalent time zero, and assumptions about enrollment distribution, dropout rates, immune priming delay, and Weibull hazard shape that cannot be verified against the actual protocol. The simulation code has not been independently audited, peer-reviewed, or verified by a third party. Bugs in the implementation could alter results materially. The conditioning constraints applied to simulated trajectories are the author's interpretation of public disclosures and may not reflect the trial's actual status. The simulation's "relative plausibility" metric is not a likelihood ratio and has no calibrated inferential meaning on any standard evidence scale. No Monte Carlo simulation, regardless of the number of trajectories generated, can predict the outcome of a real-world clinical trial. The results should be understood as a mapping of which parameter combinations are consistent with publicly observed timelines, not as quantitative predictions of efficacy, trial timing, or statistical significance. The model has not been validated against any completed clinical trial with known outcomes.
Accuracy and Third-Party Data: Clinical trial data, press releases, regulatory filings, and published literature referenced in this article are sourced from ClinicalTrials.gov, company press releases, peer-reviewed journals, and conference abstracts. While the author believes these sources to be reliable, the completeness, timeliness, or correctness of this data cannot be guaranteed. The author assumes no liability for errors, omissions, or the results obtained from the use of this information.
Disclosure of Interest: The author holds a beneficial long position in Elicio Therapeutics, Inc. (NASDAQ: ELTX). The author reserves the right to buy or sell these securities at any time without further notice. The author receives no direct compensation for the production of this content and maintains no business relationship with the company. The author has no access to non-public trial data, unblinded interim results, or internal company information. Readers should be aware that the author's financial interest in the company creates a potential for confirmation bias in model design and interpretation, despite efforts to mitigate this through systematic sensitivity analysis and the inclusion of null scenarios. Confirmation bias can manifest in subtle ways, including the choice of conditioning constraints, the plausibility ranges tested, and the framing of results. Independent replication of the simulation with alternative assumptions is encouraged.
Forward-Looking Statements & Risk: This article contains forward-looking statements regarding clinical trial timelines, potential readout windows, and statistical outcomes. These statements are based on speculative modeling and current publicly available information, and are subject to significant risks and uncertainties. Actual results may differ materially. Investing in biotechnology and pharmaceutical securities involves a high degree of risk, including the potential for total loss of principal. Past performance is not indicative of future results. No reader should rely on this article as a basis for any investment decision. The author has no obligation to update this article if new information becomes available or if the author's position changes. This content is not directed at or intended for distribution to any person or entity in any jurisdiction where such distribution would be contrary to law or regulation.
Copyright: All content, including the accompanying Python simulation code and figures, is the property of the author. This article may not be copied, reproduced, or published, in whole or in part, without the author's prior written consent.