Elicio's AMPLIFY-7P: Including PRODIGE 24 And Extending The Control DFS Corridor Still Favors Vaccine Efficacy (Monte Carlo Simulation Update)
Including PRODIGE 24 in the control arm DFS estimate and extending the control arm DFS corridor to account for a denominator asymmetry in the literature gives the null hypothesis more room. Conditioned on the March 12 H1 readout reaffirmation, the simulation still favors vaccine efficacy.

Disclosure: The author holds a beneficial long position in Elicio Therapeutics, Inc. (NASDAQ: ELTX). This article is provided for informational and educational purposes only and is not financial advice. The Monte Carlo simulation presented here is a speculative modeling exercise built on estimated trial design parameters, literature-derived survival benchmarks, and assumptions about events that are not publicly disclosed. It cannot predict the outcome of the AMPLIFY-7P trial or any other clinical study. Although the author is a Medical Doctor, this content represents a personal analytical perspective and does not constitute medical advice, a diagnosis, or a treatment recommendation. The author receives no compensation for this article and has no business relationship with the company. This article has not been independently peer-reviewed. Please see the full "Legal Information and Disclosures" section below.
Twenty-seven months have passed since Elicio Therapeutics reported that the first patient in AMPLIFY-7P was dosed on January 11, 2024, and the Phase 2 readout has still not arrived. On March 12, 2026, the company reaffirmed that the "event-driven primary DFS analysis [is] remaining on track for an anticipated 1H 2026 readout." The company remains blinded to efficacy outcomes. Since I published the results of my original Monte Carlo simulation, several readers pushed back on a modeling choice I made, and a new conditioning constraint has become available. Both warrant an update. This is my fifth article covering Elicio; I already added a tag solely for Elicio.
The original simulation deliberately used only neoadjuvant-era cohorts to calibrate the control arm. Several readers asked why I excluded PRODIGE 24, the definitive adjuvant mFOLFIRINOX trial. The reason was that I wanted to stress-test the delay against the most favorable control-arm assumptions available. To my best knowledge, neoadjuvant FOLFIRINOX has become the dominant treatment pathway for resectable and borderline-resectable PDAC in the U.S., and patients who complete it, undergo successful resection, and enter a trial like AMPLIFY-7P represent a selected population with relatively long expected DFS. If the delay under the null cannot be explained away even under these generous DFS assumptions, it may be rather signal than noise. In reality, however, AMPLIFY-7P very likely contains patients who were resected upfront and received adjuvant therapy. We have no information on the actual proportions. In fact including the survival data reported in PRODIGE 24 makes the ongoing delay of AMPLIFY-7P harder to explain under the null, not easier.
When I wrote my original Monte Carlo simulation, I used my own estimate for the therapy-to-vaccination gap when converting historical DFS to a vaccination-equivalent time zero. In February 2026, Huff, Haldar et al. at Johns Hopkins published the results of an independent mKRAS vaccine study, which include a directly measured median of approximately 4 months from end of therapy to first vaccine dose in 12 resected PDAC patients. I covered this trial in detail in my article on the Hopkins mKRAS vaccine data. The sample is small, and the gap could be shorter or longer in AMPLIFY-7P depending on site-specific practices and patient selection. But it is a directly measured value in the same clinical context: resected PDAC patients moving from completed therapy to first vaccination and I can now replace the estimate with a direct measurement.
The reaffirmation of the study readout in H1 2026 also justifies an update of my priors: Elicio has access to the blinded event count, and the fact that it reaffirmed the readout in H1 2026 on March 12 means the company believes the event target is reachable. I incorporate this as a conditioning constraint.
One thing should be clear: all the results of my model are built on historical survival data. It might just be that patients who underwent state of the art therapy in 2024 have a substantially improved survival and the delay is just a consequence and is no effect of any vaccine efficacy, meaning ELI-002 shows no efficacy at all. The track record of therapeutic cancer vaccines remains dismal, especially in pancreatic cancer.
PRODIGE 24's 21.4-month DFS from randomization (Conroy et al., JAMA Oncology, 2022) does not map directly onto AMPLIFY-7P without lead-time correction. AMPLIFY-7P measures DFS from randomization, which occurs after completion of all prior therapy (including adjuvant therapy if administered), at approximately the point when vaccination would begin in the treatment arm. For an adjuvant-treated patient reaching this time point, the gap between PRODIGE 24's randomization (estimated eight weeks post-surgery) and AMPLIFY-7P's randomization (post-chemo, post-recovery) consists of the chemotherapy duration plus the operational recovery time before randomization eligibility. Subtracting the lead time (six months of adjuvant mFOLFIRINOX plus 4 months from end of therapy to vaccination) yields a vaccination-equivalent DFS of roughly 11.4 months, with a plausible range of perhaps 9 to 13 months given uncertainty in chemotherapy duration and the therapy-to-vaccination gap.
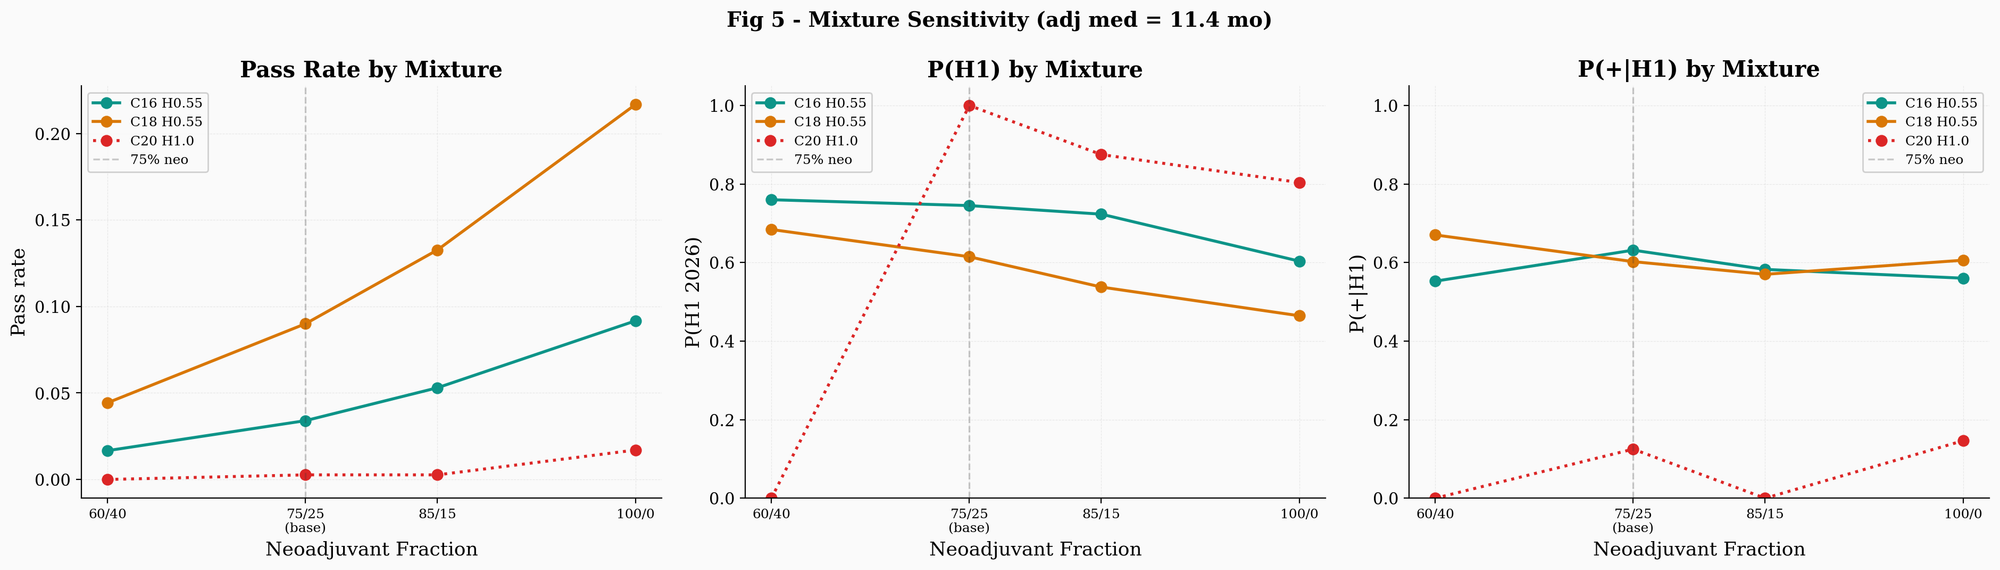
The control arm now follows a mixture model: with a given probability, each simulated patient draws DFS from the neoadjuvant Weibull distribution (parameterized as before by the control median that the simulation sweeps over), and with the remaining probability draws from a shorter Weibull with median 11.4 months, reflecting the PRODIGE 24 adjuvant estimate. The base case uses 75% neoadjuvant / 25% adjuvant. I chose this as a rough estimate, not because I have data on the actual composition of AMPLIFY-7P, but because neoadjuvant FOLFIRINOX has become common for resectable and borderline-resectable PDAC since approximately 2018 to 2020, while a meaningful fraction of patients still receive adjuvant-only therapy. The sensitivity analysis tests 85/15 and 60/40, and also 100/0 (equivalent to the original simulation with no adjuvant component).
In this update, I also applied the Hopkins 4-month therapy-to-vaccination offset consistently to all five literature studies, replacing the ad-hoc lead-time estimates I used in the original simulation. For each study, the lead time is calculated as the duration of post-time-zero therapy (chemotherapy cycles, or zero if last therapy was time-zero itself) plus 4 months. The Hopkins cohort included patients where approximately half received neoadjuvant therapy, so for those patients "completion of prior therapy" means surgery, and the 4 months already incorporates post-surgical recovery and logistical delay before vaccination. This framework yields: PANACHE01 at roughly 6.4 months (from 12.4, subtracting 2 months of neoadjuvant chemo plus 4), Alliance at roughly 12.0 months (from 20.0, subtracting 4 months plus 4), TAPS at roughly 17.0 months (from 21.0, subtracting only 4 since time-zero was surgery), and UCSF at roughly 29 months (from 38.0, subtracting 5 months plus 4). These estimates are somewhat lower than the ad-hoc values I used previously, which shifted the literature range downward. The central corridor of the simulation is now approximately 13 to 26 months, with PANACHE01 at the lower extreme and UCSF at the upper.
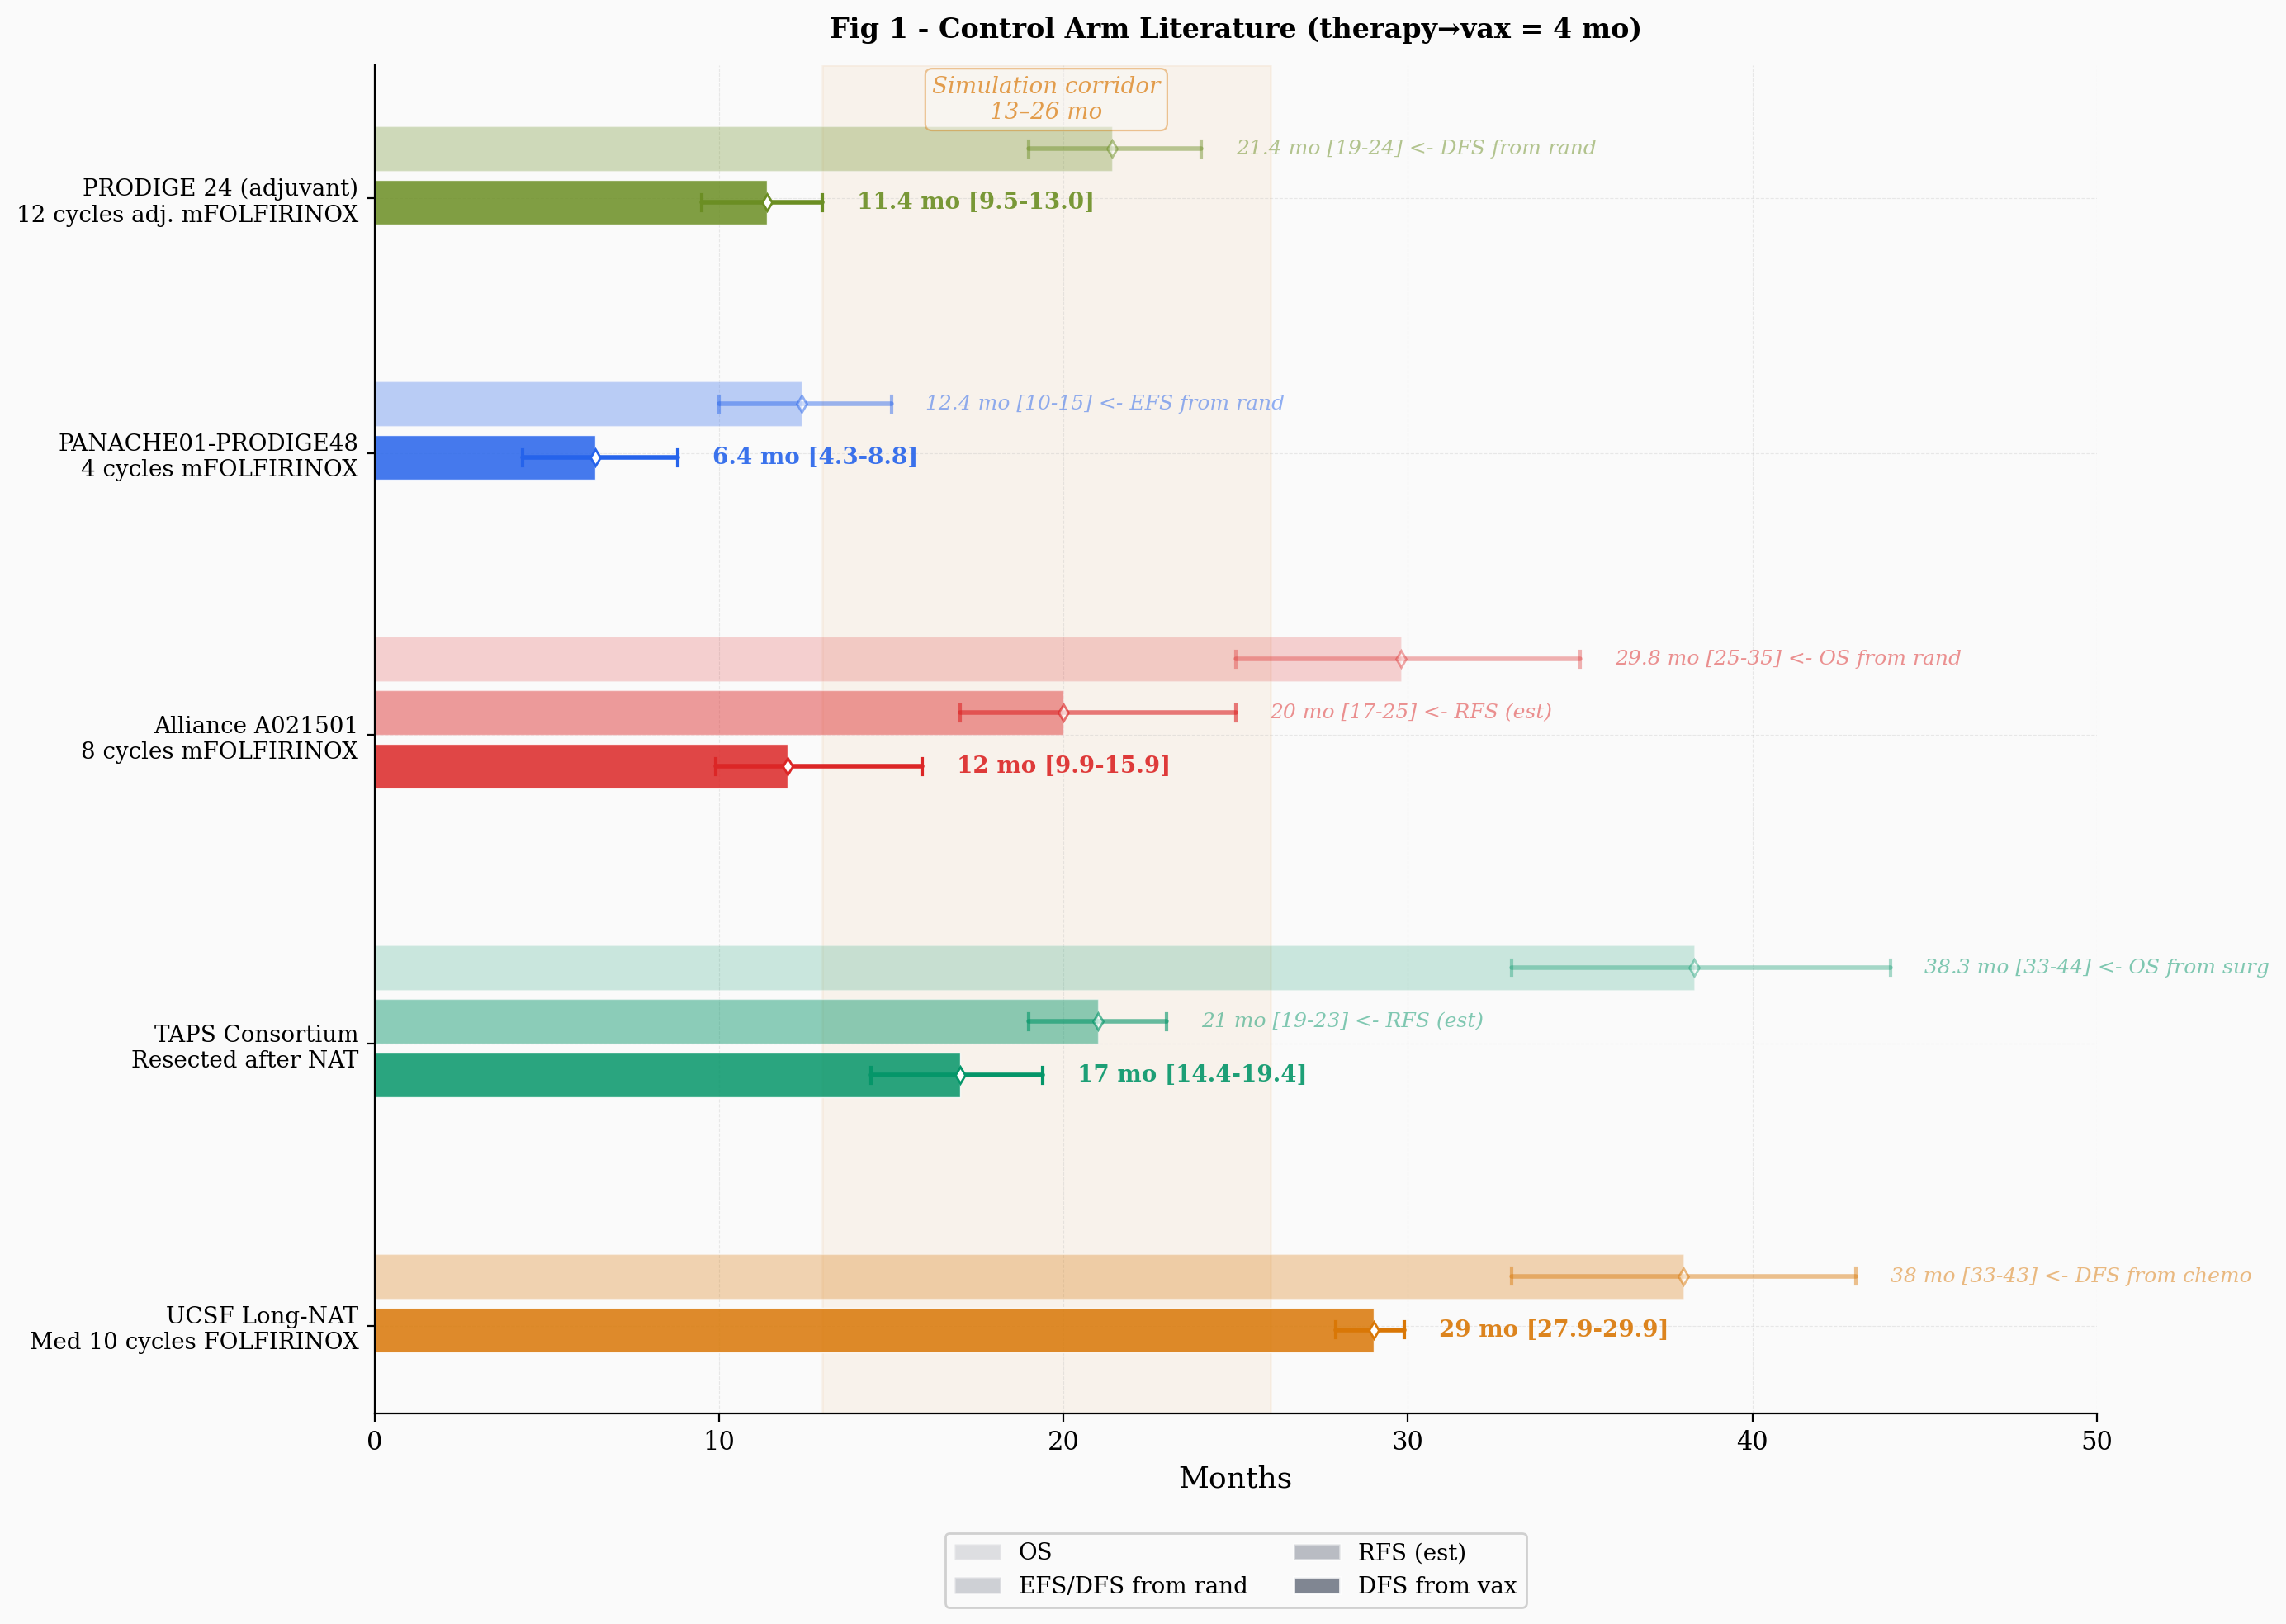
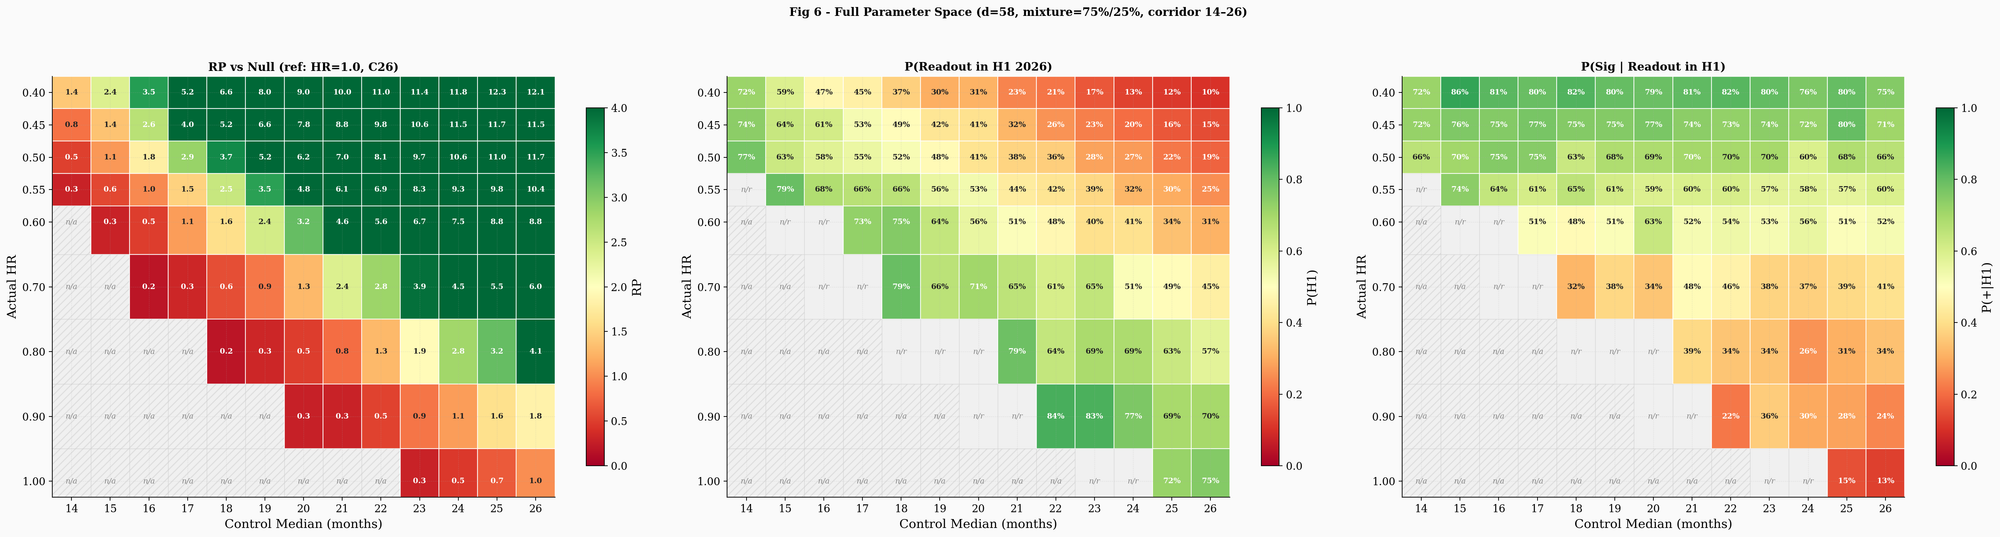
Adding PRODIGE 24 to the control-arm calibration introduces a shorter-survival adjuvant component that compresses the null hypothesis timeline and mechanically increases relative plausibility for efficacy scenarios. Any modeling change that moves exclusively in one direction warrants scrutiny for confirmation bias, particularly from an author with a long position. To counterbalance, I extended the upper bound of the neoadjuvant sweep. The mixture model makes this necessary on its own terms: once the adjuvant component is calibrated separately at 11.4 months, the sweep parameter governs only the neoadjuvant subpopulation, and its plausible range should be anchored on studies whose denominators match. PANACHE01 and Alliance are intention-to-treat analyses from randomization whose denominators include patients who progressed during chemotherapy and never reached surgery. UCSF and TAPS condition on completed resection, which is the same selection that AMPLIFY-7P applies. The neoadjuvant sweep should therefore cover the full range of resection-conditioned estimates, not stop below them. The heatmap (Figure 6) now extends from 14 to 26 months. This gives the null hypothesis substantially more room to explain the observed delay as a consequence of a genuinely long-lived control arm rather than vaccine efficacy, and partially offsets the downward pressure from the adjuvant mixture component.
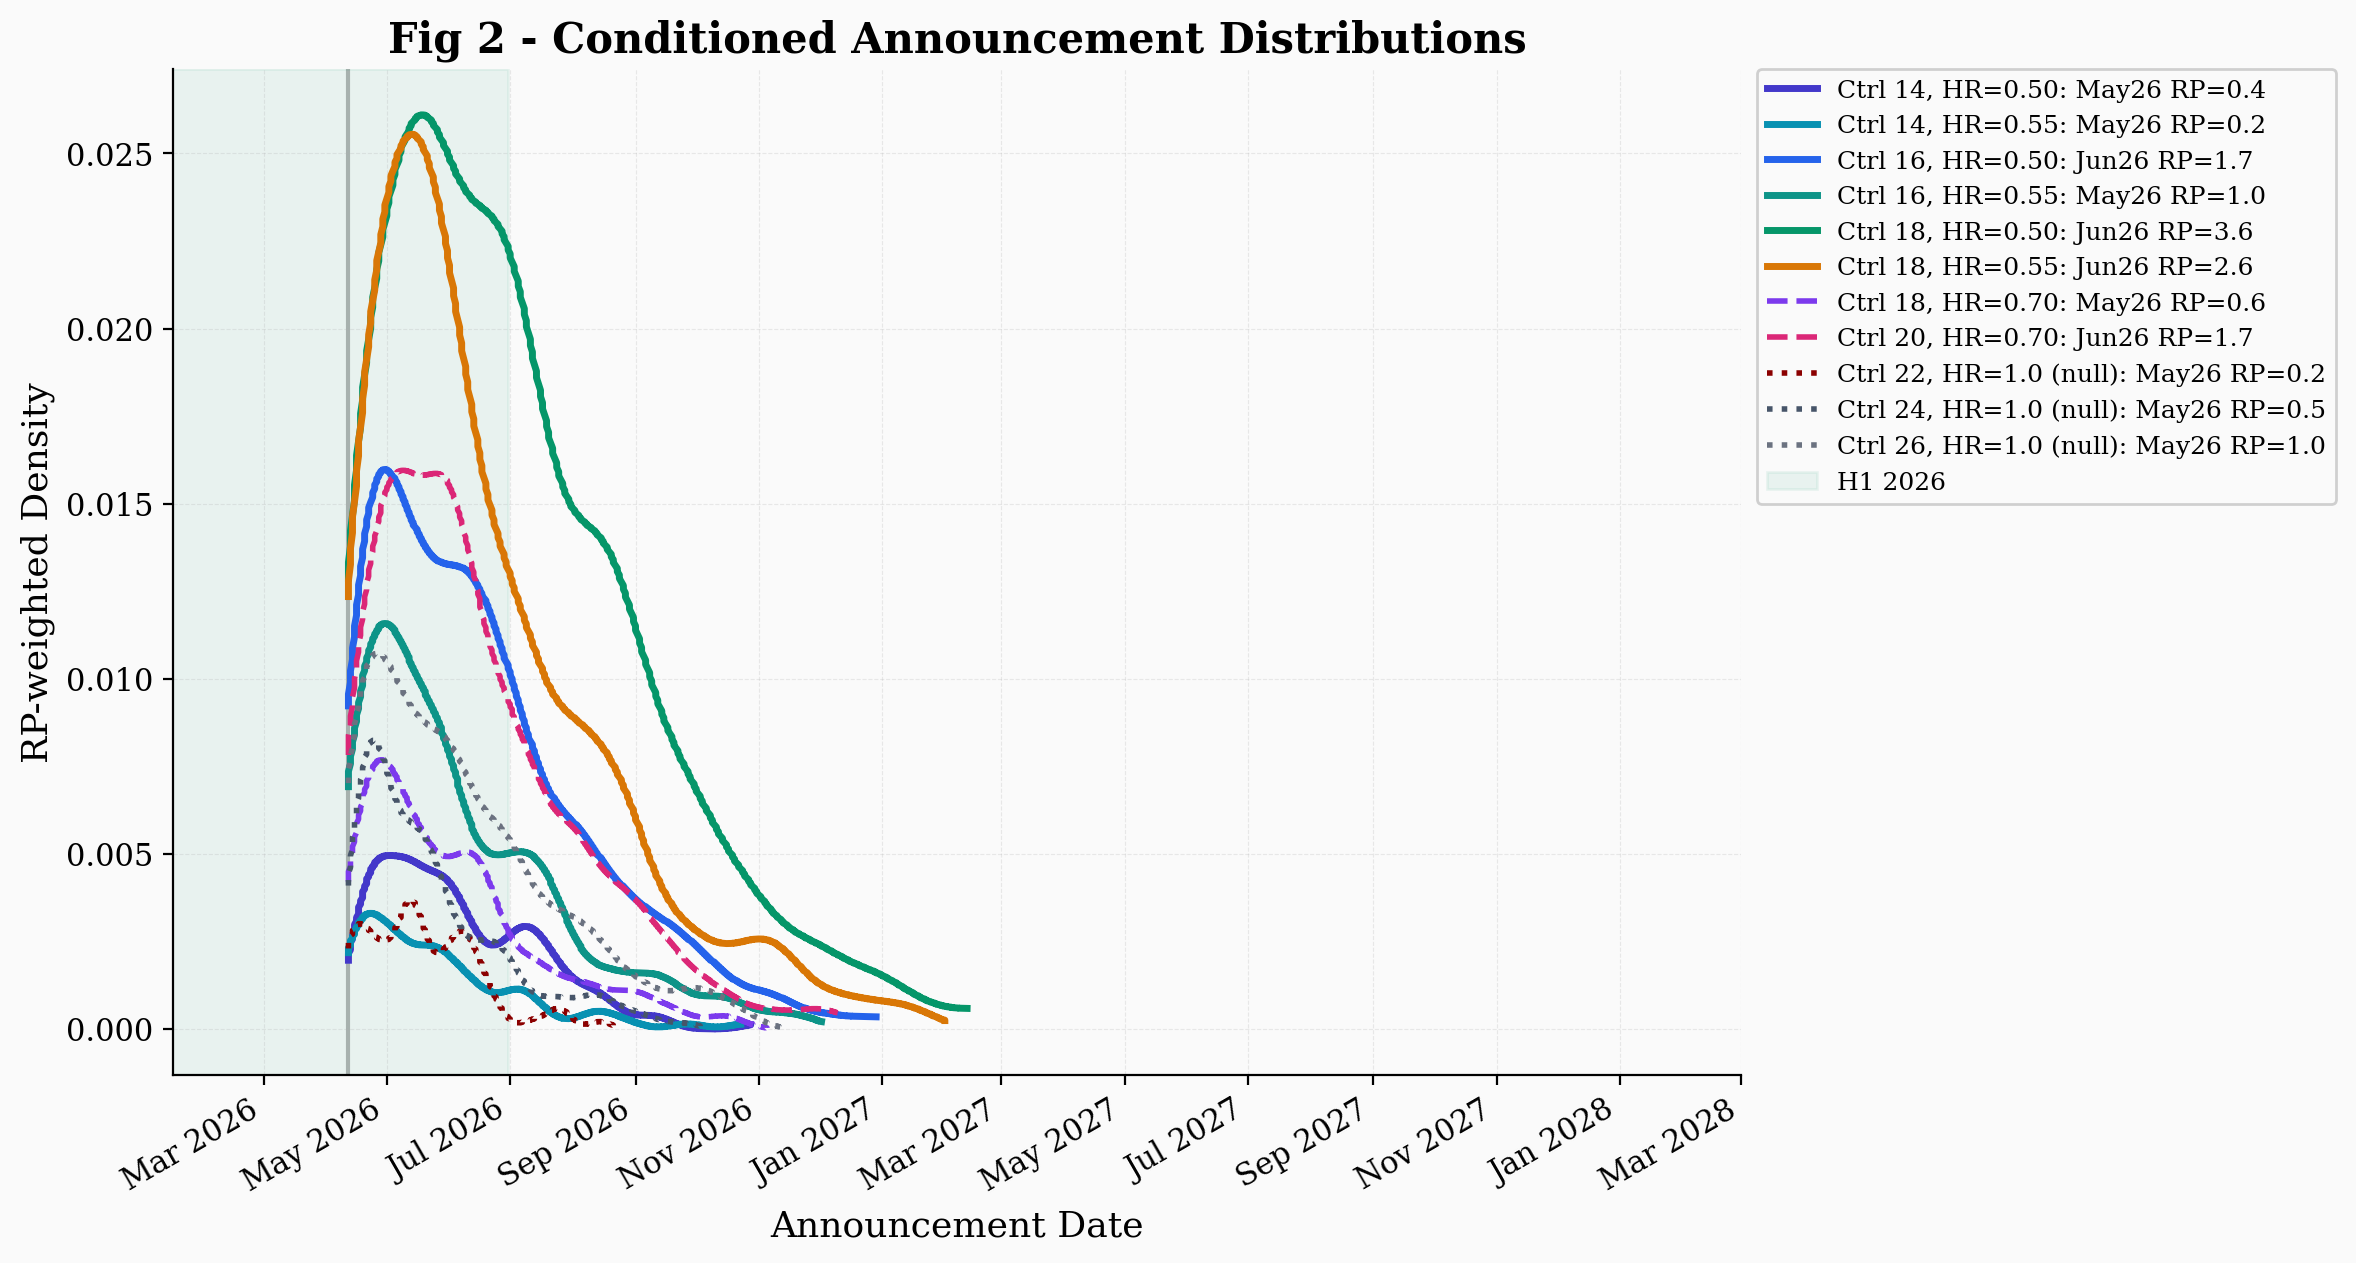
The March 12 reaffirmation introduces an additional conditioning constraint. The company has access to the current blinded event count. The fact that it reaffirmed H1 2026 on March 12, with full knowledge of the event accumulation pace, means the company believes the event target will be reached in time. I incorporate this by conditioning on readout within H1 2026 (the d-th event occurring before the H1 deadline, accounting for operational lag). Previously, P(readout in H1 2026) was an output probability. Now, justified by the reaffirmation, it becomes a filter. Only trajectories that actually read out in H1 are retained. This conditioning has an asymmetric effect. Under efficacy, the vaccine delays events, which makes H1 readout less likely (P(H1) for Ctrl 18 / HR = 0.55 is roughly 66%). Under the null with a long control arm, events accumulate at full speed and P(H1) is higher (roughly 72% for Ctrl 26 / HR = 1.0). The H1 filter therefore removes a larger fraction of efficacy trajectories than null trajectories. This means the H1-conditioned relative plausibility is lower than the unconditioned RP. The reaffirmation is not a guarantee: companies sometimes miss guidance, and "on track" is weaker than "confirmed."
The simulation reference date is April 12, 2026. All other model architecture remains identical to the original article.
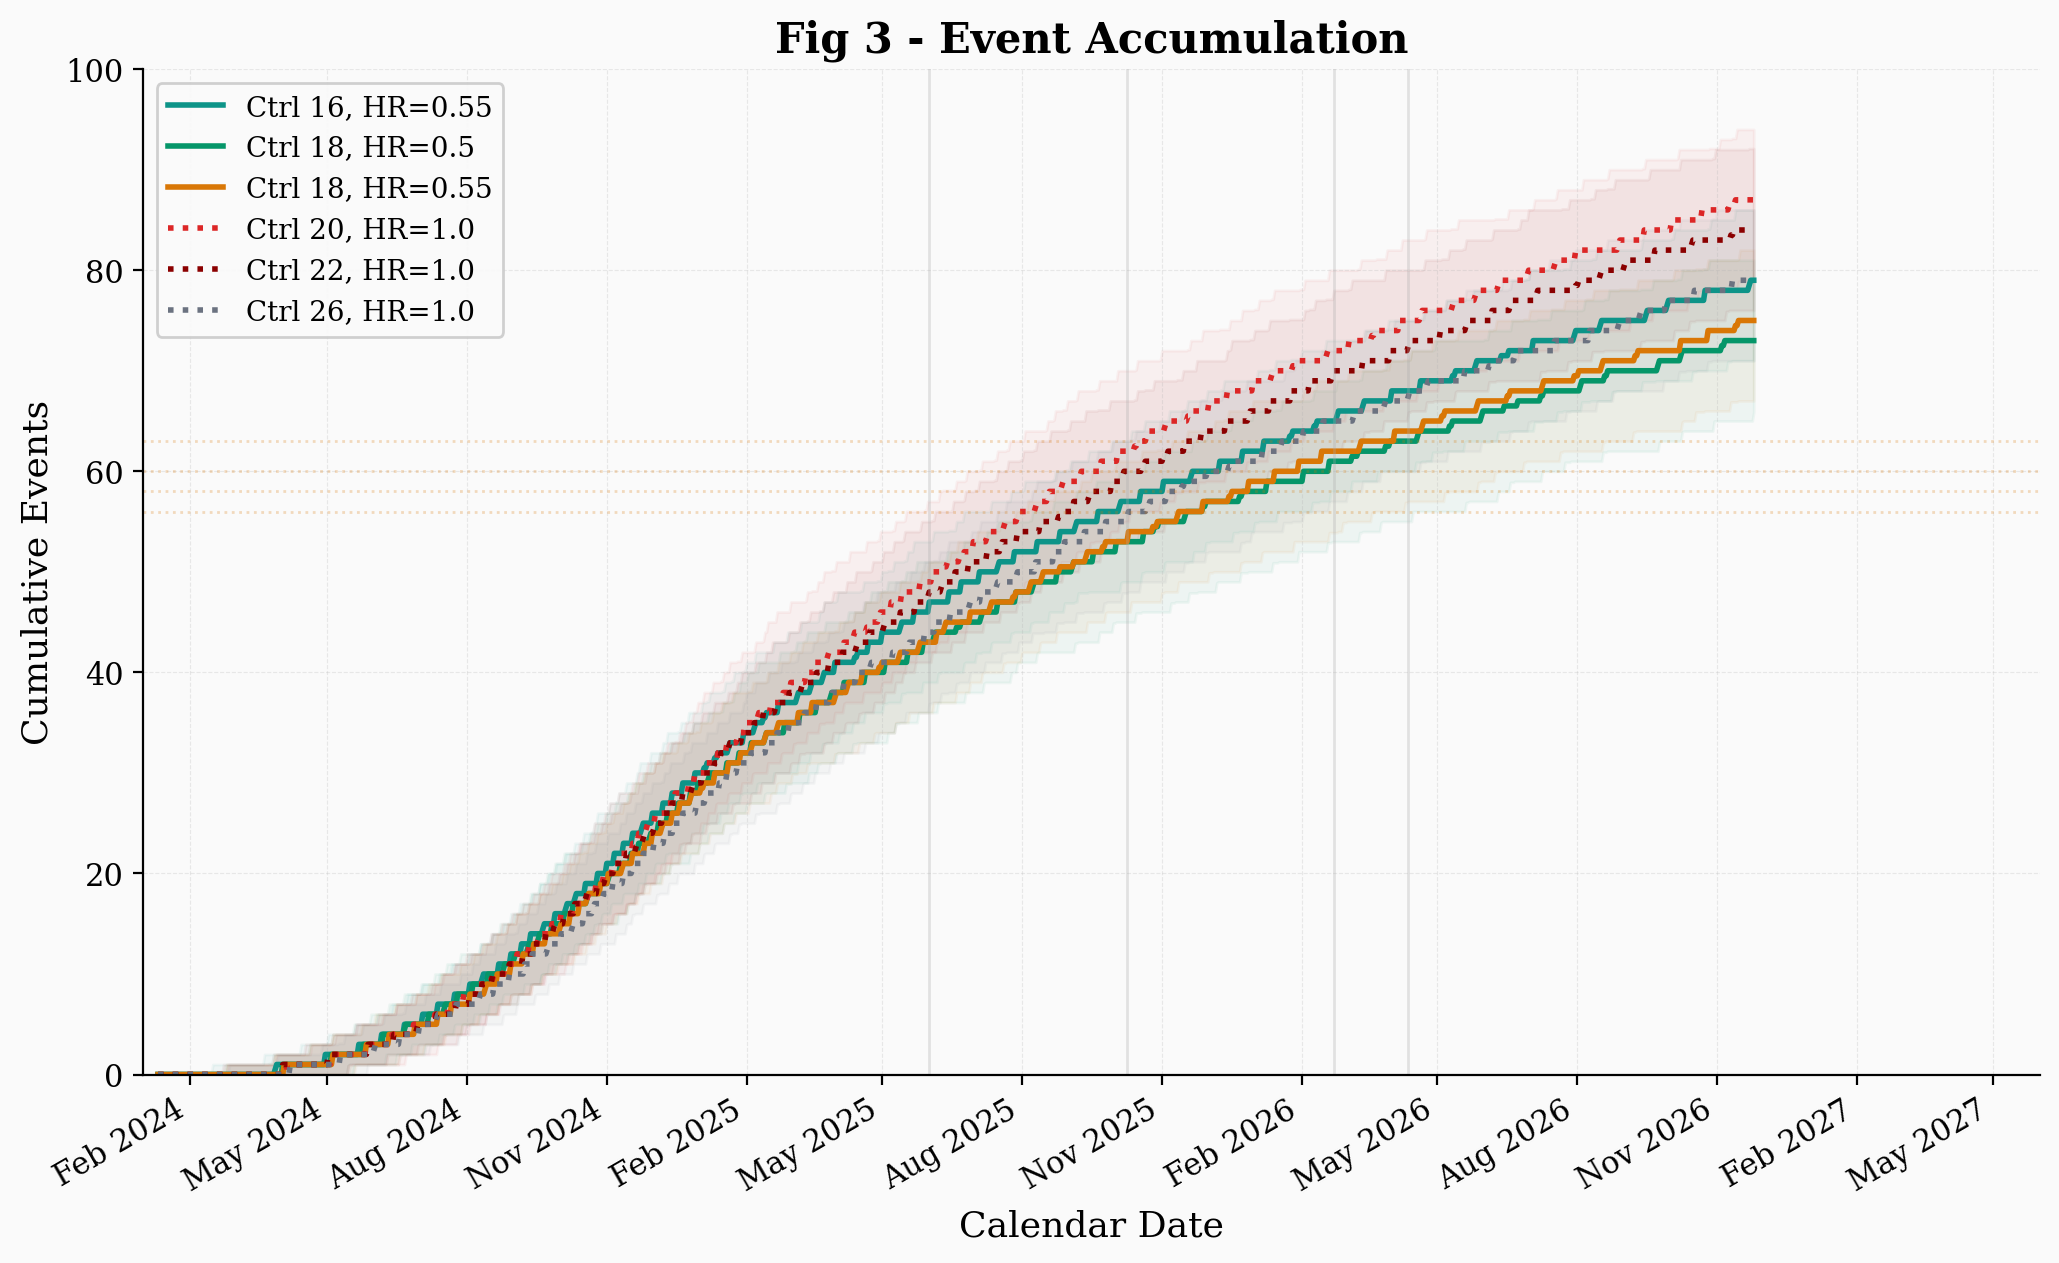
The effect of the mixture model on the simulation is substantial. Adding an adjuvant subpopulation with shorter median DFS means events accumulate faster in both arms. Under the null hypothesis (HR = 1.0, no vaccine effect), faster events should push the trial toward its event target sooner. This compresses the null-hypothesis timeline.
The best null scenario (Ctrl 26, HR = 1.0) passes the conditioning filters (including the H1 constraint) at a rate of approximately 3.4%, while shorter-control-arm nulls pass at lower rates (Ctrl 22 at roughly 0.7%, Ctrl 24 at roughly 1.6%). Efficacy scenarios show pass rates of roughly 0.8% to 12%, depending on control median and hazard ratio. The relative plausibility (RP) of efficacy scenarios relative to the best null is as follows: Ctrl 18 / HR = 0.50 reaches an RP of roughly 3.6, Ctrl 18 / HR = 0.55 roughly 2.6, and Ctrl 16 / HR = 0.55 roughly 1. Without the H1 filter, the unconditioned RPs are moderately higher because the filter disproportionately removes efficacy trajectories where the vaccine delays its own readout beyond H1. In the original simulation, the highest RP was approximately 3. These numbers should be interpreted with caution. RP depends on Monte Carlo sampling, and the values shift with different random seeds and trajectory counts, particularly for the null where only a fraction of trajectories pass the filters.
Relative plausibility is not a likelihood ratio or a Bayes factor; it has no calibrated inferential interpretation. An RP of 3 means only that the efficacy scenario produces conditioned trajectories consistent with the publicly known observations roughly 3 times more frequently than the best null. The RP is sensitive to the upper bound of the corridor: the best null is the HR = 1.0 scenario with the highest pass rate, and extending the corridor to 26 months gives the null a much larger control-median range to work with. The degree to which the null benefits from this additional room depends on whether control medians of 24 to 26 months are realistic for AMPLIFY-7P's population, which is unknown.
Once we condition on H1 readout, the more important metric shifts from RP to P(positive | H1): given that the readout happens in H1, what is the probability that the result crosses the significance boundary? The simulation estimates P(+|H1) at roughly 68% for Ctrl 18 / HR = 0.50, roughly 60% for Ctrl 18 / HR = 0.55, and roughly 60% for Ctrl 16 / HR = 0.55. For the best null (Ctrl 26, HR = 1.0), P(+|H1) is roughly 14%, based on 245 H1 trajectories.
The event accumulation plot shows the same effect from a different angle. Under the mixture model, even the null scenarios reach the event target somewhat earlier than in a pure neoadjuvant simulation, because the adjuvant subpopulation contributes early events regardless of whether the vaccine works. This compresses the calendar window in which different scenarios overlap.
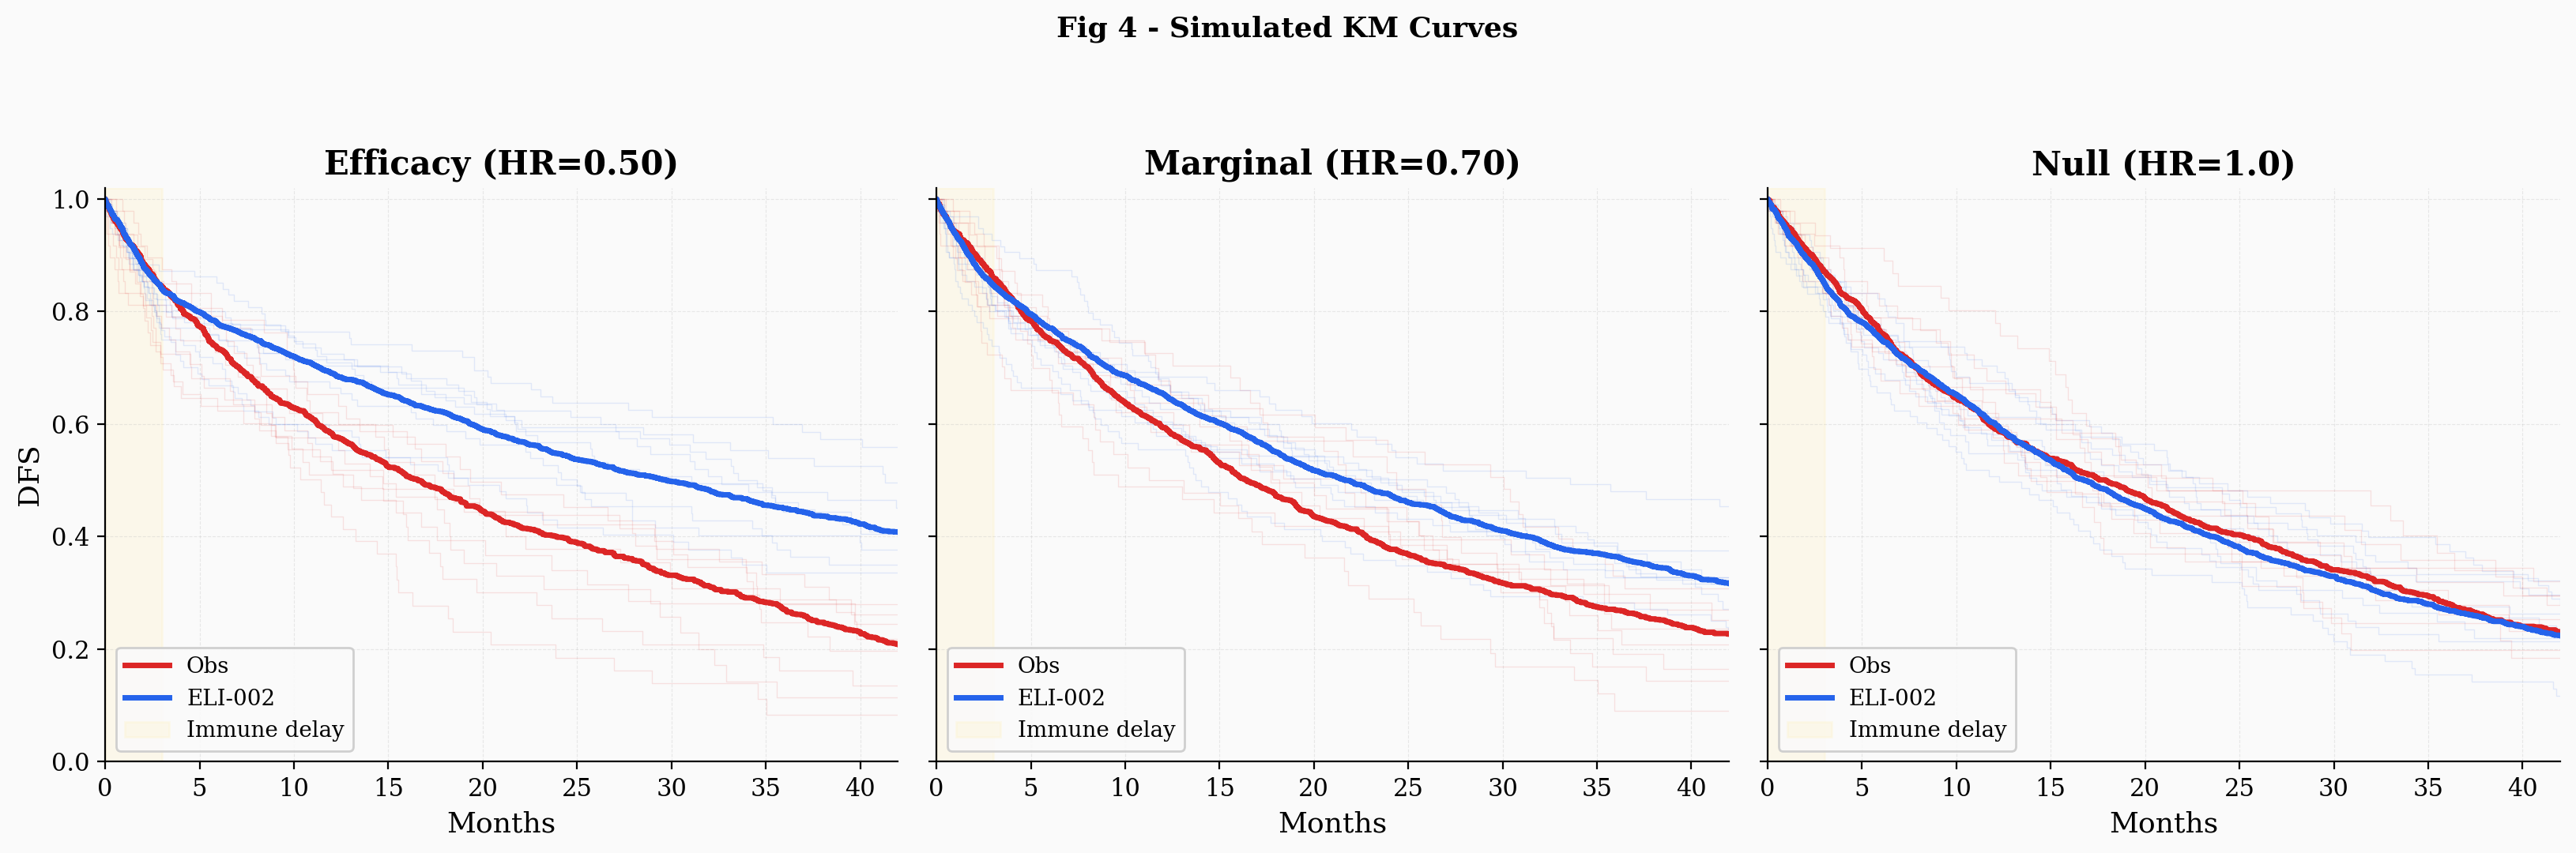
The simulated Kaplan-Meier curves under the mixture model show a feature worth noting. The control arm exhibits a subtle inflection: a somewhat faster early decline (driven by patients drawn from the adjuvant distribution) followed by a more gradual tail (driven by patients drawn from the neoadjuvant distribution).
The mixture sensitivity sweep is perhaps the most informative output of this update. It shows how the results depend on the assumed adjuvant fraction. At 60/40 (40% adjuvant), the null pass rate drops close to zero, and efficacy RPs increase further. At 100/0 (no adjuvant component), the null recovers plausibility. The takeaway is that any nonzero adjuvant fraction, even a modest one, shifts the balance away from the null. How much it shifts depends on the fraction, which is unknown.
A separate sensitivity worth noting concerns the interim futility threshold. The simulation conditions on the trial continuing past the interim analysis, which requires the IA Z-statistic to exceed a minimum value (Z_IA_FUT = 0.25 in the base case). Under the null, roughly 60% of trajectories fall below this threshold and are eliminated, while under efficacy only roughly 10% are eliminated. This differential is the single largest driver of relative plausibility in the model. The threshold is an estimate of the IDMC's decision boundary, which is not publicly known. If the actual boundary was lower (or if the futility rule was non-binding), the null would retain more trajectories and RP values would decrease. Readers should consider this range when interpreting the headline RP numbers.
The three-panel heatmap (Figure 6) maps the full parameter space across 3,000 Monte Carlo trajectories per cell, covering control medians from 14 to 26 months and hazard ratios from 0.40 to 1.0. The left panel shows RP relative to the best null in this run (the HR = 1.0 cell with the highest pass rate, which varies by run). Cells with fewer than 15 conditioned trajectories are masked as "n/a." The center panel shows P(readout in H1 2026). Strong efficacy with a long control arm pushes P(H1) below 30%, because the vaccine actively suppresses the events the trial needs. The right panel shows P(positive | H1 readout). For hazard ratios of 0.50 to 0.55 across control medians of 16 to 20, P(+|H1) sits broadly in the 53 to 70% range. At HR = 0.70 it drops to roughly 36 to 43%. At HR = 0.80, the probability of a significant result even conditional on H1 readout falls below 35%. The heatmap makes the core tradeoff concrete: the parameter region most consistent with the observed delay (strong efficacy, long control arm) is also the region where the trial is least likely to read out in H1, but most likely to be positive if it does.
The limitations of this analysis remain the same as in the original article, with a few additions. The event target, the IDMC's exact data, and the control arm's actual survival distribution are all unknown. The mixture model adds two more assumptions: the adjuvant fraction and the PRODIGE 24-derived median. Both could be wrong. If the true adjuvant fraction is lower than 15%, or if adjuvant patients in AMPLIFY-7P have longer DFS than PRODIGE 24 predicted (plausible if site selection or eligibility criteria enrich for favorable prognosis), the mixture effect weakens or disappears. The Hopkins lead-time measurement comes from 12 patients at one institution; the actual therapy-to-randomization gap in AMPLIFY-7P could differ. Applying the same 4-month offset uniformly to all five literature studies is a simplification: the actual therapy-to-vaccination gap likely varies by treatment pathway, institution, and patient population, and using a single value derived from one small cohort introduces correlated error across all control-arm estimates. The March 12 reaffirmation, while informative, is not a guarantee: companies sometimes miss guidance. The simulation still cannot access what the IDMC saw in the unblinded data, and the relative plausibility metric has no calibrated statistical meaning.
What the update shows is that including PRODIGE 24, the data point my readers asked about, makes the null hypothesis harder to sustain under the tested assumptions. The degree to which it does so depends on how many AMPLIFY-7P patients followed the adjuvant pathway. At the 75/25 base case, conditioning on H1 readout per the March 12 reaffirmation, P(positive | H1) reaches 60 to 70% for central efficacy scenarios (HR 0.50 to 0.55, control median 16 to 18 months) versus 14% for the best null (HR = 1.0, control median 26 months). Efficacy scenarios produce conditioned trajectories roughly 1× to 3.6× more frequently than the best null, though this ratio is sensitive to both the corridor width and the assumed adjuvant fraction: as the mixture sensitivity sweep shows, increasing the adjuvant fraction compresses the null while removing it entirely restores the null's ability to explain the delay.
How long the control-arm DFS actually is in AMPLIFY-7P remains unknown. Huff, Haldar et al. reported a median DFS of only 6.35 months from first vaccination in 12 resected PDAC patients who received an mKRAS vaccine with dual checkpoint blockade. The simulation corridor begins at 14 months, more than double this figure, meaning the assumptions underlying the model are conservative, and they still favor efficacy. Readers should weight these results according to their own estimate of the trial's adjuvant/neoadjuvant composition and the plausible range of the control median.
Follow me on X for frequent updates (@chaotropy).
Legal Information and Disclosures
General Disclaimer & No Financial Advice: The content of this article is for informational and educational purposes only. It represents the personal opinions of the author as of the date of publication and may change without notice. The author is not a registered investment advisor or financial analyst. This content is not intended to be, and shall not be construed as, financial, legal, tax, or investment advice. It does not constitute a personal recommendation or an assessment of suitability for any specific investor. This article does not constitute an offer to sell, a solicitation of an offer to buy, or a recommendation of any security. Readers should conduct their own independent due diligence and consult with a certified financial professional before making any investment decisions. This article is not a securities research report and has not been prepared in accordance with legal requirements designed to promote the independence of investment research.
Medical Disclaimer: Although the author possesses a medical background, the information presented here regarding clinical trials, survival endpoints, or pharmaceutical mechanisms is strictly for the purpose of educational discussion and general commentary regarding the underlying science. It does not constitute medical advice, a diagnosis, or a treatment recommendation, nor does it establish a physician-patient relationship. Readers should never disregard professional medical advice or delay in seeking it because of something read on this website. Always consult a qualified healthcare provider regarding any medical condition.
Monte Carlo Simulation Disclaimer: The simulation presented in this article is a speculative modeling exercise. It relies on estimated trial design parameters (including the event target, interim analysis timing, and group sequential boundaries), literature-derived control arm survival benchmarks converted to a vaccination-equivalent time zero, and assumptions about enrollment distribution, dropout rates, immune priming delay, Weibull hazard shape, and the neoadjuvant/adjuvant mixture fraction and its component medians that cannot be verified against the actual protocol. The simulation code has not been independently audited, peer-reviewed, or verified by a third party. Bugs in the implementation could alter results materially. The author holds a long position in the company, which creates a potential for confirmation bias in model design and interpretation: choices such as the conditioning constraints, the plausibility ranges tested, the lead-time assumptions, the mixture model composition, and the framing of results may unconsciously favor efficacy scenarios despite efforts to mitigate this through systematic sensitivity analysis and the inclusion of null scenarios. The conditioning constraints applied to simulated trajectories are the author's interpretation of public disclosures and may not reflect the trial's actual status. The simulation's "relative plausibility" metric is not a likelihood ratio and has no calibrated inferential meaning on any standard evidence scale. No Monte Carlo simulation, regardless of the number of trajectories generated, can predict the outcome of a real-world clinical trial. The results should be understood as a mapping of which parameter combinations are consistent with publicly observed timelines, not as quantitative predictions of efficacy, trial timing, or statistical significance. The model has not been validated against any completed clinical trial with known outcomes.
Accuracy and Third-Party Data: Clinical trial data, press releases, regulatory filings, and published literature referenced in this article are sourced from ClinicalTrials.gov, company press releases, peer-reviewed journals, and conference abstracts. While the author believes these sources to be reliable, the completeness, timeliness, or correctness of this data cannot be guaranteed. The author assumes no liability for errors, omissions, or the results obtained from the use of this information.
Disclosure of Interest: The author holds a beneficial long position in Elicio Therapeutics, Inc. (NASDAQ: ELTX). The author reserves the right to buy or sell these securities at any time without further notice. The author receives no direct compensation for the production of this content and maintains no business relationship with the company. The author has no access to non-public trial data, unblinded interim results, or internal company information. Readers should be aware that the author's financial interest in the company creates a potential for confirmation bias in model design and interpretation, despite efforts to mitigate this through systematic sensitivity analysis and the inclusion of null scenarios. Confirmation bias can manifest in subtle ways, including the choice of conditioning constraints, the plausibility ranges tested, and the framing of results. Independent replication of the simulation with alternative assumptions is encouraged.
Forward-Looking Statements & Risk: This article contains forward-looking statements regarding clinical trial timelines, potential readout windows, and statistical outcomes. These statements are based on speculative modeling and current publicly available information, and are subject to significant risks and uncertainties. Actual results may differ materially. Investing in biotechnology and pharmaceutical securities involves a high degree of risk, including the potential for total loss of principal. Past performance is not indicative of future results. No reader should rely on this article as a basis for any investment decision. The author has no obligation to update this article if new information becomes available or if the author's position changes. This content is not directed at or intended for distribution to any person or entity in any jurisdiction where such distribution would be contrary to law or regulation.
Copyright: All original content, including text and images, is the property of the author and may not be copied, reproduced, or published, in whole or in part, without prior written consent, except as permitted by applicable law or the terms of the platform on which it is published. Use of this content for training machine learning or AI models is not permitted without explicit authorization. Third-party or public domain images remain subject to their respective rights and are not claimed as the author's property.


